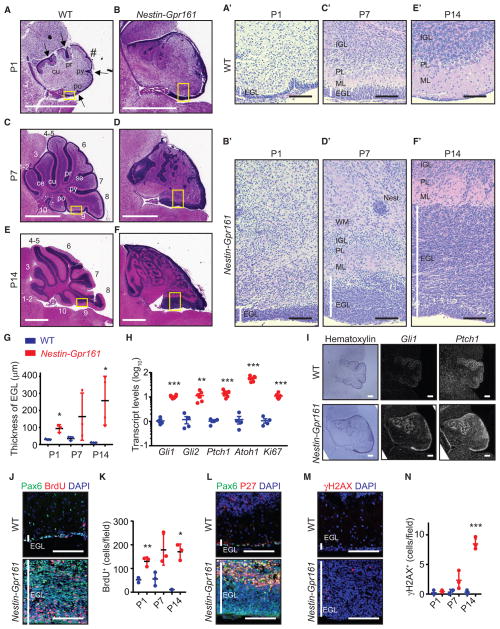
Figure 4. GC Progenitor Proliferation and Dysplasia during Postnatal Development following Gpr161 Deletion.
(A–F) H&E-stained sagittal sections showing the thickened EGL, decreased foliation, and cerebellar dysplasia of Nestin-Gpr161 cko mice (B, D, and F) compared with the WT (Gpr161fl/fl or Gpr161fl/+) (A, C, and E) for P1 (A and B), P7 (C and D), and P14
(E and F). Arrows indicate fissures, and # indicates an expected fissure. Abbreviations for fissures: ce, precentral; cu, preculminate; pr, primary; se, secondary; py, pyramidal; po, posteriolateral. (A′–F′) High-magnification pictures of the yellow boxes in (A)–(F). White vertical lines indicate the EGL layer. PL, Purkinje/Bergmann glia layer; Nest, small proliferative nest (confirmed by BrdU staining); WM, white matter.
(G) The thickness of the EGL is increased in Nestin-Gpr161 cko mice compared with littermate controls. n = 3–4 mice/genotype.
(H) qRT-PCR analysis shows increased Shh pathway transcripts in the cerebellums of Nestin-Gpr161 cko mice compared with that of the WT at P14. n = 4–6 per genotype.
(I) Radioisotopic in situ hybridization shows increased Gli1 and Ptch1 transcript levels in the EGL of Nestin-Gpr161 cko mice compared with littermate control mice at P1. Hematoxylin staining shows the morphology of the cerebellum.
(J–N) Temporal changes of (J and K) BrdU+ (1-h pulse) GC progenitors, (L) P27+ GC progenitors, and (M and N) γH2AX+ cells in the EGL of cerebellums of Nestin-Gpr161 cko mice at P14. Note that data from Figure 3L at P7 are included in (K) for comparison. n = 3 mice/genotype.
All data represent mean ± SD. Scale bars indicate 1mm(A–F), 100 μm(A′–F′, J, L, and M), and 200 μm(I). *p < 0.05, **p < 0.01, and ***p < 0.01 by Student’s t test. Nuclei are stained by DAPI. See also Figure S4.

