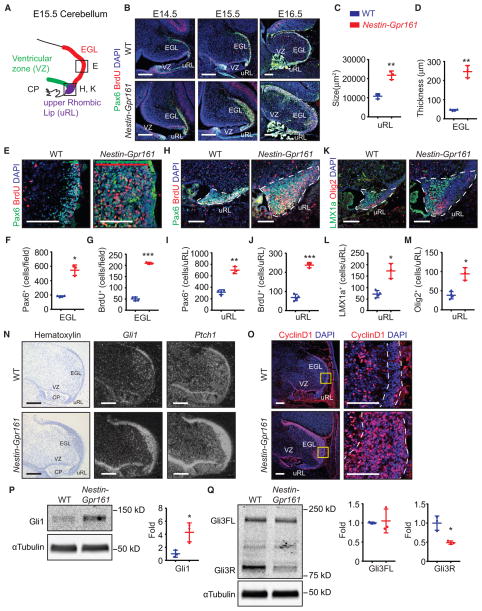
Figure 5. Gpr161 Limits Premature Shh Signaling in GC Progenitors during Embryogenesis.
(A) A cartoon of the cerebellar anlage at E15.5. EGL, formative external granule layer; uRL, upper rhombic lip; VZ, ventricular zone; CP, hindbrain choroid plexus.
(B) Pax6+- and BrdU+-stained sagittal sections show gradual thickening of the formative EGL at different embryonic stages in Nestin-Gpr161 cko mice.
(C and D) Increased area of the uRL (C) and thickened formative EGL (D) are shown in Nestin-Gpr161 cko mice (n = 3) compared with WT mice (n = 4) at E16.5.
(E–G) Representative images of proliferating GC progenitors in the formative EGL at E16.5 of Nestin-Gpr161 cko mice (n = 3) and WT mice (n = 4) (E). The location of the EGL region depicted is indicated in the black box in (A). The extent of the EGL (Pax6+) and BrdU+ proliferating cells is shown using a green and red bar, respectively. The numbers of (F) Pax6+ GC progenitors and (G) BrdU+ (1 h incorporation) proliferating cells are increased in the EGL regions of Nestin-Gpr161 cko mice compared with that of the WT at E16.5.
(H–J) Representative pictures of Pax6+ GC progenitors and BrdU+ proliferating cells in the uRL of E16.5 Nestin-Gpr161 cko mice and WT mice (H). The location is indicated in the black box in (A). The numbers of (I) Pax6+ GC progenitor cells and (J) BrdU+ proliferating cells are increased in the uRL of Nestin-Gpr161 mice (n = 3) compared with the WT (n = 4) at E16.5.
(K–M) Representative pictures of Lmx1a+ and Olig2+ cells in the uRL of E16.5 Nestin-Gpr161 cko mice (n = 3) and WT mice (n = 4) (K). The location is indicated in the black box in (A). The numbers of (L) Lmx1a+ and (M) Olig2+ cells are increased in the uRL of Nestin-Gpr161 cko mice compared with that of the WT at E16.5.
(N) Radioisotopic in situ hybridization showed increased Gli1 and Ptch1 transcript levels in the formative EGL, outer uRL, and VZ of Nestin-Gpr161 cko mice compared with WT mice at E15.5. Hematoxylin staining shows the morphology of the cerebellum.
(O) Representative images of CyclinD1+ cells in the cerebellum of E15.5 Nestin-Gpr161 cko mice and littermate control mice. The EGL is marked by white dotted lines.
(P and Q) Immunoblotting for Gli1 (P) and Gli3 (Q) and quantification (after normalization with α-tubulin levels) in E15.5 cerebellar anlagen of control littermates and Nestin-Gpr161 cko mice (n = 3 each). High Gli1 levels and low Gli3R levels are seen in Nestin-Gpr161 cko mice. Gli3FL, Gli3 full-length; Gli3R, Gli3 repressor.
All data represent mean ± SD. Scale bars indicate 200 μm (B, N, and O, left) and 100 μm (E, H, K, and O, insets). Nuclei are stained by DAPI. *p < 0.05, **p < 0.01, ***p < 0.001 by Student’s t test. WT, littermate control (Nestin-Cre; Gpr161fl/+ or Gpr161fl/fl or Gpr161fl/+). (B) is a tiled image. See also Figure S5.

