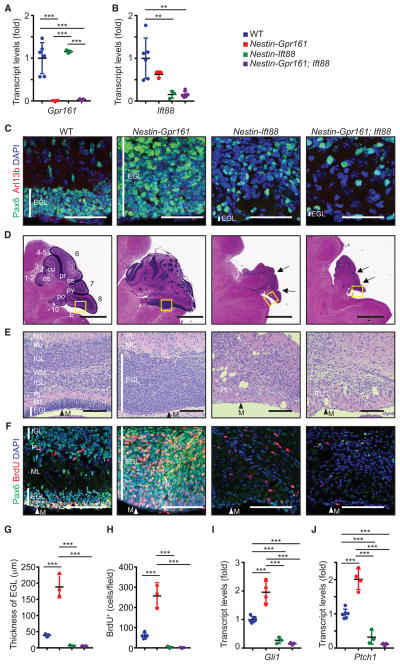
Figure 6. Gpr161 Prevents GC Progenitor Proliferation in a Cilium-Dependent Manner.
(A and B) Gpr161 (A) and Ift88 (B) transcript levels in P7 cerebellums of WT, Nestin-Gpr161 cko, Nestin-Ift88 cko, and Nestin-Gpr161; Ift88 dko mice. n = 3–6 mice per genotype.
(C) Representative pictures of Arl13b+ primary cilia in Pax6+ GC progenitors in the EGL in the cerebellum of WT, Nestin-Gpr161 cko, Nestin-Ift88 cko, and Nestin-Gpr161; Ift88 dko mice at P7. Note that Arl13b+ primary cilia are not observed in the rudimentary EGL of Nestin-Ift88 cko and Nestin-Gpr161; Ift88 dko mice.
(D and E) H&E-stained sagittal sections of the corresponding insets in (D) as depicted in (E) shows increased thickness of the EGL in Nestin-Gpr161 cko mice and almost nonexistent EGL and partial foliation in Nestin-Ift88 cko mice and Nestin-Gpr161; Ift88 dko mice at P7. Arrows point to rudimentary fissures.
(F) Representative pictures of Pax6+ GC progenitors and BrdU+ proliferating cells in the EGL at P7. Vertical white lines denote extent of EGL (C, E, and F). M, meninges (E and F).
(G) Thickness of the EGL of P7 cerebellum. n = 3–6 mice per genotype.
(H) Number of BrdU+ cells (upon 1-h pulse) measured in the EGL of P7 cerebellums of the designated genotypes. n = 3–6 mice/genotype.
(I and J) qRT-PCR analysis shows increased Shh pathway transcripts, Gli1 (I) and Ptch1 (J), in the cerebellums of Nestin-Gpr161 cko mice compared with that of WT and Nestin-Gpr161; Ift88 dko mice at P7. n = 3–6 mice/genotype.
Scale bars indicate (C) 50 μm, (D) 1 mm, and (E and F) 100 μm. Nuclei are stained by DAPI. **p < 0.01, ***p < 0.001 by one-way ANOVA with Tukey’s multiple comparisons test. Nestin-Gpr161 cko is Nestin-Cre; Gpr161fl/fl; Ift88fl/+; Nestin-Ift88 cko is Nestin-Cre; Ift88fl/fl; Gpr161fl/+; Nestin-Gpr161; Ift88 dko is Nestin-Cre; Gpr161fl/fl; Ift88fl/fl; WT is littermate control (Nestin-Cre; Gpr161fl/+; Ift88fl/+ or Gpr161fl/fl; Ift88fl/fl or Gpr161fl/+; Ift88fl/fl or Gpr161fl/fl; Ift88fl/+). The other abbreviations are as in Figures 4 and 5.

