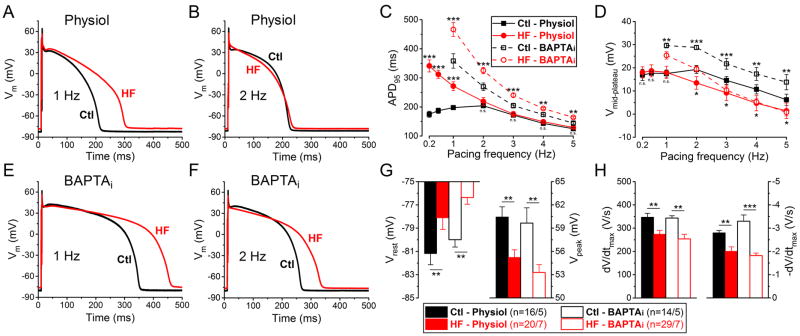
Figure 1. Frequency- and Ca2+-dependent changes of AP parameters in HF.
(A–B) Representative action potentials (APs) recorded at 1 Hz and 2 Hz pacing in heart failure (HF) and healthy age-matched control cells with physiological solutions (Physiol). (C–D) Frequency dependence of AP duration measured at 95% of repolarization (APD95) and mid-plateau potential (Vmid-plateau). (E–F) Representative APs when cytosolic Ca2+ was buffered to nominally zero using 10 mM BAPTA in pipette solution (BAPTAi) at 1 Hz and 2 Hz pacing. (G) Resting membrane potential (Vrest) is less negative in HF in line with decreased AP peak (Vpeak) at 1 Hz. (H) Both maximal rate of rise (dV/dtmax) and maximal rate of phase 3 repolarization (-dV/dtmax) are significantly decreased in HF at 1 Hz. Columns and bars represent mean±SEM. n refers to cells/animals measured in each group. ANOVA with Bonferroni posttest, Ctl vs. HF, *p<0.05, **p<0.01, ***p<0.001.

