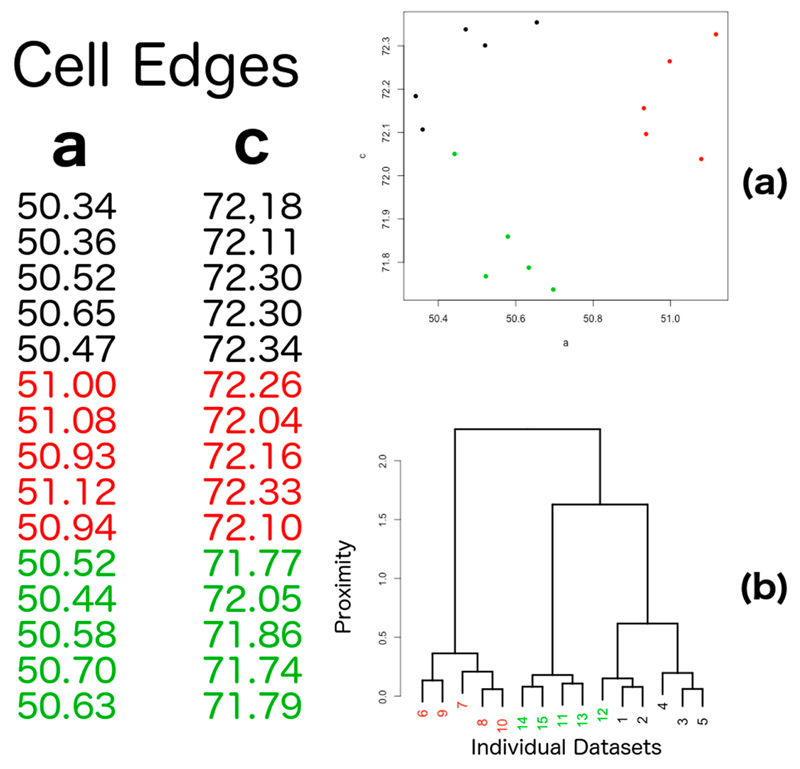
Figure 1.
Hierarchical clustering, based on cell parameters for a simulated group of 15 crystals in a tetragonal space group. (a) Only lengths a and c of the unit cell are variable quantities useful to describe crystal variation in the tetragonal system (see data in panel on the left). The 15 crystals are separated in three groups (black, red and green) with similar structural features (crystal isomorphism). Cell parameters alone can be insufficient to discriminate among isomorphous groups. In this specific example, crystal 12 is closer to the black group than to the green group because the size of its unit cell is closer to the unit cell size of crystals 1 and 2; (b) Dendrogram reflecting hierarchical cluster analysis for the 15 crystals just described. The three isomorphous groups are well separated with the exception of crystal 12, forming a cluster with the black, rather than the green group.

