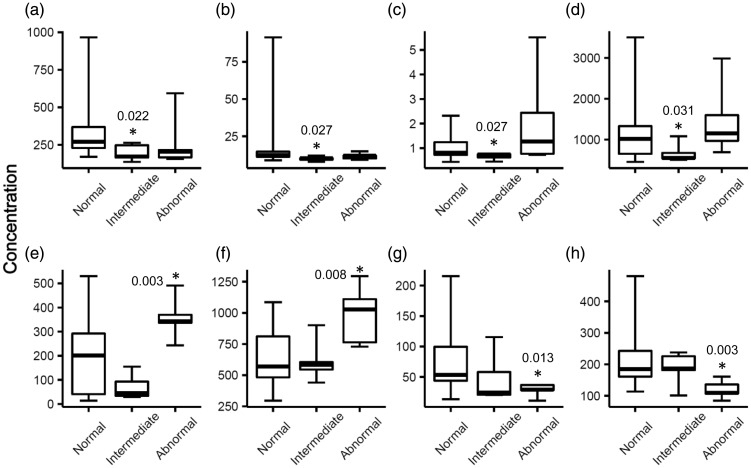
Figure 1.
Proteins that had differential plasma levels in the intermediate or abnormal patient group as compared to the normal group before DOX treatment (T0). An asterisk denotes the protein had a statistically significant different level in that group as compared to the normal group. P-values were calculated by Welch’s t-test and indicated by the asterisks. Edges of boxes denote 25th and 75th percentiles, lines are median concentrations, and error bars are minimum and maximum concentrations. (a) CXCL1 (pg/mL), (b) CCL3 (pg/mL), (c) GDF-15 (ng/mL), (d) haptoglobin (µg/mL), (e) CCL23 (pg/mL), (f) CCL27 (pg/mL), (g) CXCL6 (pg/mL), and (h) sICAM-1 (ng/mL). GDF-15: growth/differentiation factor 15; sICAM-1: soluble intercellular adhesion molecule 1.

