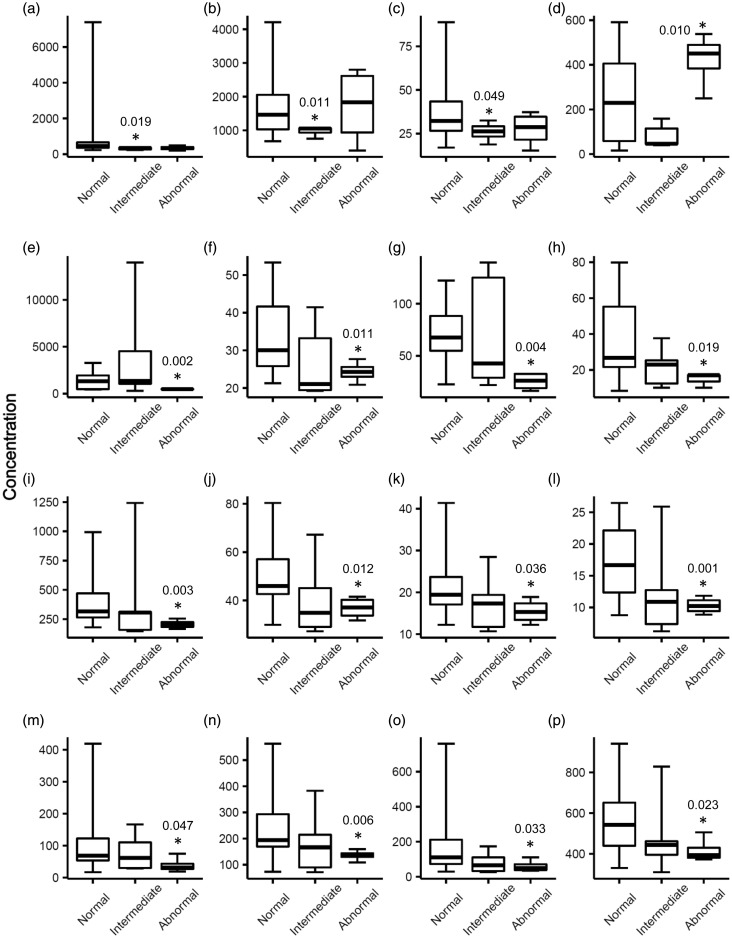
Figure 2.
Proteins that had differential plasma levels in the intermediate or abnormal patient group as compared to the normal group after the first cycle of DOX treatment (T1). An asterisk denotes the protein had a statistically significant different level in that group as compared to the normal group. P-values were calculated by Welch’s t-test and indicated by the asterisks. Edges of boxes denote 25th and 75th percentiles, lines are median concentrations, and error bars are minimum and maximum concentrations. (a) IL-16 (pg/mL), (b) FABP3 (pg/mL), (c) myoglobin (ng/mL), (d) CCL23 (pg/mL), (e) CXCL5 (pg/mL), (f) CCL26 (pg/mL), (g) CXCL6 (pg/mL), (h) GM-CSF (pg/mL), (i) CXCL1 (pg/mL), (j) IFN-γ (pg/mL), (k) IL-2 (pg/mL), (l) IL-8 (pg/mL), (m) CXCL11 (pg/mL), (n) CXCL9 (pg/mL), (o) CCL17 (pg/mL), and (p) CCL25 (pg/mL). FABP3: fatty acid-binding protein 3; GM-CSF: granulocyte-macrophage colony-stimulating factor; IFN-γ: interferon gamma; IL-2: interleukin 2; IL-8: interleukin 8; IL-16: interleukin 16.

