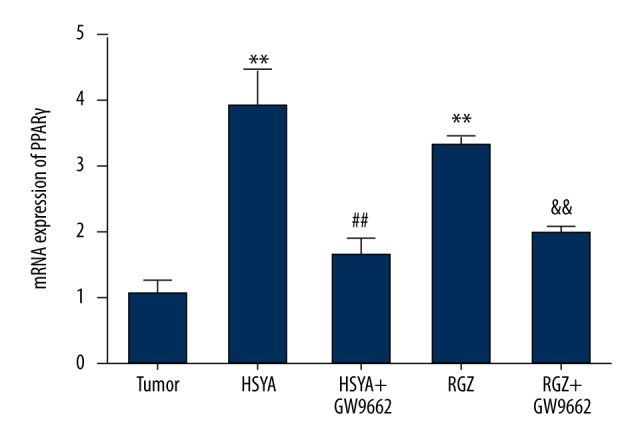
Figure 9.

Effect of HSYA on PPARγ mRNA expression in BGC-823 cells treated with drugs at different concentrations: HSYA 100 μM, RGZ 5 μM, GW9662 10 μM. Compared with tumor group: **P<0.01; compared with HSYA group: ## P<0.01; compared with RGZ group: && P<0.01 (n=3).
