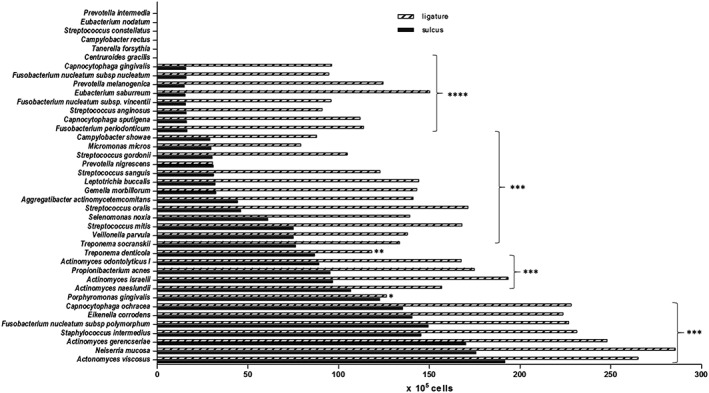
Figure 3.

Bacterial detection levels in ligature (black bar) and paper point (pattern bar) samples. The horizontal axis shows DNA probe counts of 40 oral bacteria (105 cells). The vertical axis shows bacterial species. Higher amounts of bacteria were collected from ligatures than with paper points. Statistical analysis revealed a significant difference between sulcus and ligature sampling for all species. Mann–Whitney test; *p < .05; **p < .01; ***p < .001; ****p < .0001
