
Figure 2.
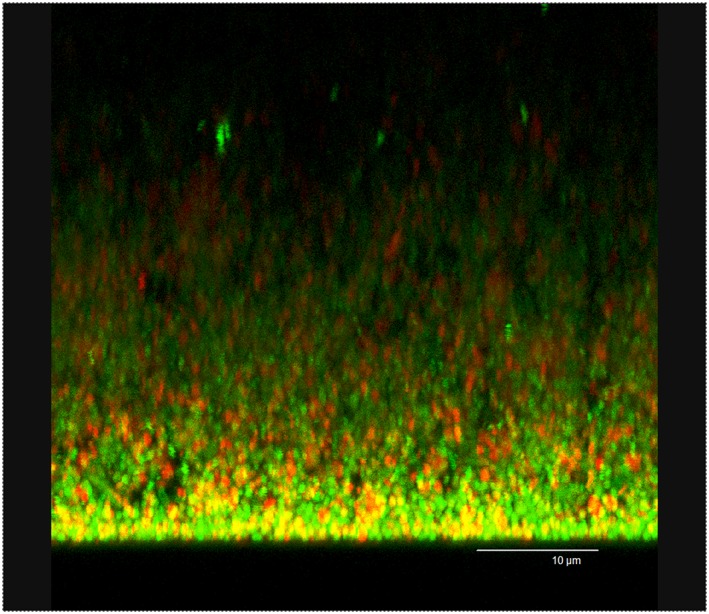
CLSM image in maximum projection of the series taken in xzy axis of the 3‐day old biofilm. Viable and nonviable bacterial cells are depicted in green and red, respectively. Scale bar: 10 μm
Official websites use .gov
A
.gov website belongs to an official
government organization in the United States.
Secure .gov websites use HTTPS
A lock (
) or https:// means you've safely
connected to the .gov website. Share sensitive
information only on official, secure websites.
CLSM image in maximum projection of the series taken in xzy axis of the 3‐day old biofilm. Viable and nonviable bacterial cells are depicted in green and red, respectively. Scale bar: 10 μm