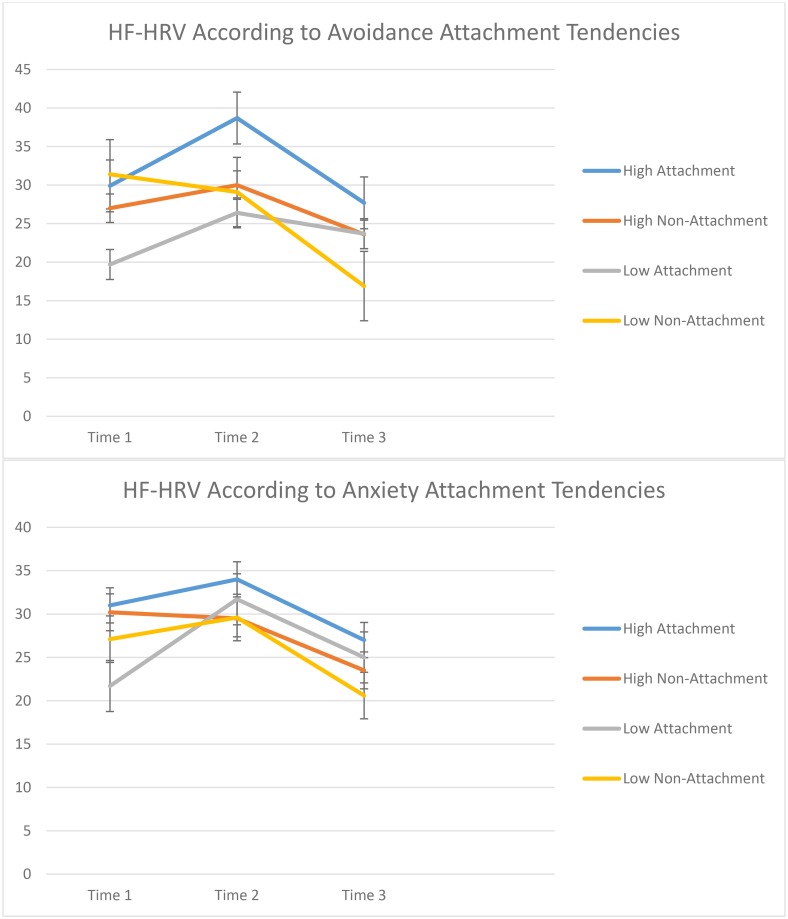
Fig 2. Average high frequency-heart rate variability across the three assessment periods for attachment prime and non-attachment prime groups.
Error bars indicate standard error of the mean (SEM). High Attachment = High levels on relevant attachment style in the attachment prime condition. High Non-Attachment = High levels on relevant attachment style in the non-attachment prime condition. Low Attachment = Low levels on relevant attachment style in the attachment prime condition. Low Non-Attachment = Low levels on relevant attachment style in the non-attachment prime condition.

