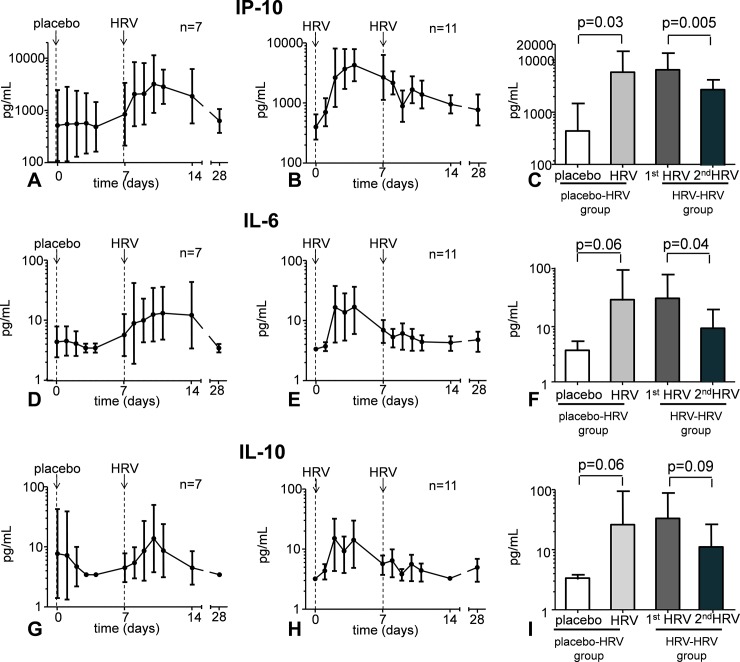
Fig 4.
Cytokine levels in nasal wash following placebo inoculation and HRV challenge (panels A, D, and G) and following two HRV challenges separated by one week time (panels B, E, and H). Panels C, F, and I show the peak levels in the first four days post-challenge in the group that received placebo, followed by a HRV challenge (bar 1 and 2), and in the group that were challenged with HRV twice (bar 3 and 4). Data are represented as geometric mean and 95% CI. Lower detection limits were 3.2 pg/mL for IL-6 and IL-10, and 156 pg/mL for IP-10.

