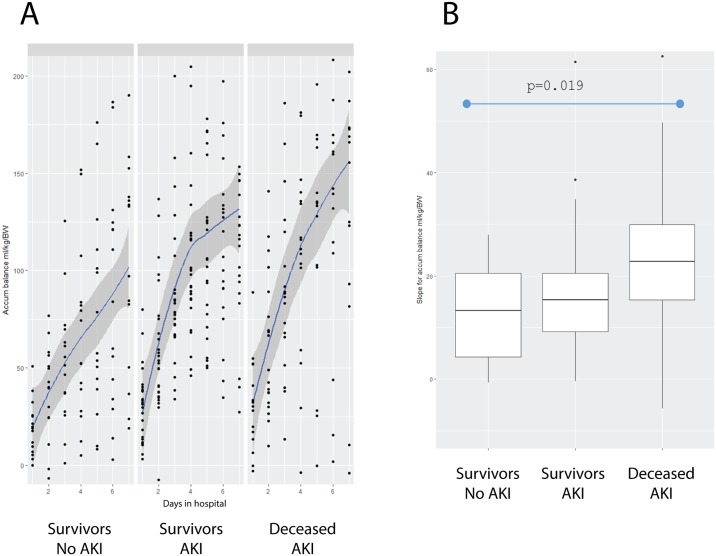
Fig 2. Fluid accumulation rate per groups.
(A) Estimated linear model in the group of Survivors-No AKI; the Survivors-AKI Group; and the Deceased-AKI group during the study period of 7 days. (B) The different slopes in the group of Survivors-No AKI; the Survivors-AKI group; and the Deceased-AKI group during the study period of 7 days.

