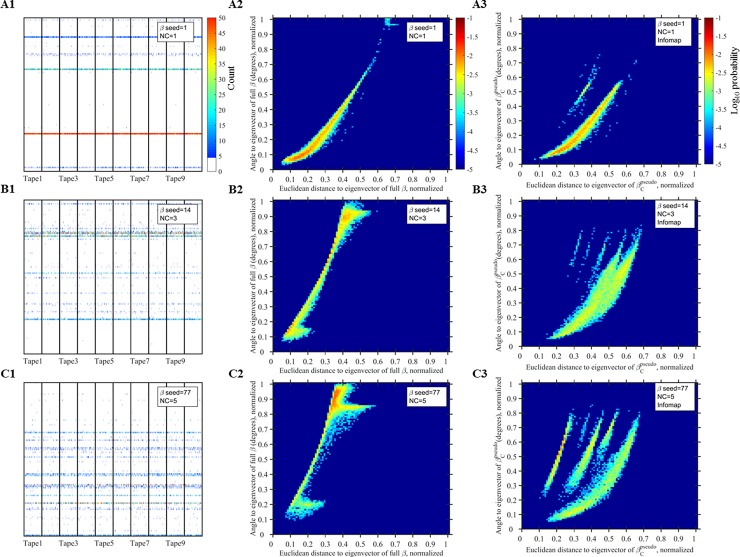
Fig 3. Examples of GARD simulations under different β’s.
(A1-C1) Histories of different tapes; For each tape, assemblies from different generations are plotted along the X axis, and color represents the counts of each of the NG molecule types in each assembly (recorded at assembly size Nmax (Fig 1). Tapes are separated by a vertical black line. For each tape, the first 1,000 assemblies are shown. Red color represents counts ≥ 50, and for brevity counts < 5 are colored white. (A2-C2) Density plots; For each assembly shown in panels (A1-C1), its Euclidean distance and angle vs. the eigenvector of the full-β was calculated (normalized for the maximum value between two assemblies, for distance and 90 degrees for angle). Color is normalized probability (log10 scale) of an assembly having a certain angle and distance. See section: Compotype-community assignment. (A3-C3) Same as (A2-C2), except for each assembly the distance and angle are calculated against the one eigenvector of β* which has the lowest angle to this assembly. Number of Infomap communities detected is: 9 (A3), 7 (B3) and 6 (C3). Further examples are available at http://ico2s.org/data/extras/gard/ and [73].

