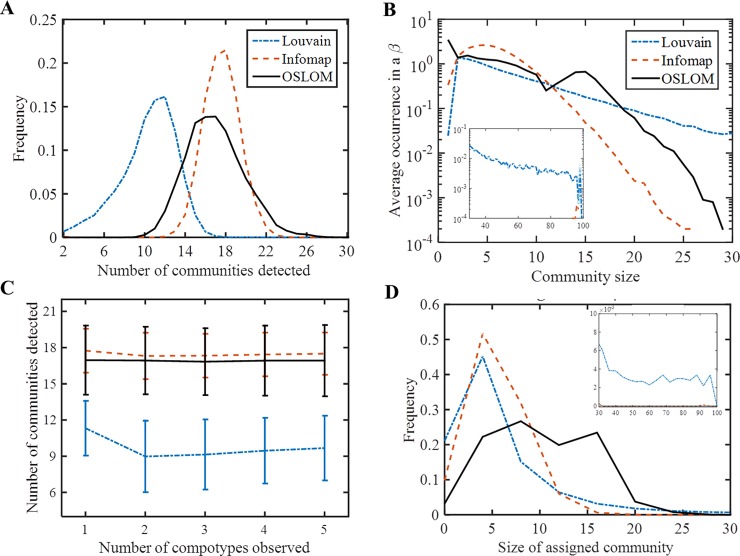
Fig 4. Communities in β’s.
(A) Histogram of total number of communities detected in each network, for the 3 algorithms. Frequency is given out of the 104 β’s studied here. (B) Average occurrence of community-sizes. An occurrence of 10−4 means that this community-size appeared only in 1 β out of the 10,000 studied here and an occurrence of 1 means that on average each β has one community with this size. Insert show the occurrence of sizes > 30. (C) Average number of communities detected vs. number of observed compotype species shows no correlation. Vertical bars mark standard deviation. (D) Histogram of the size of assigned communities, when a community is assigned to a compotype based on eigenvector similarity (see section: Compotype-community assignment). Mean and standard deviation are given in Table 1.

