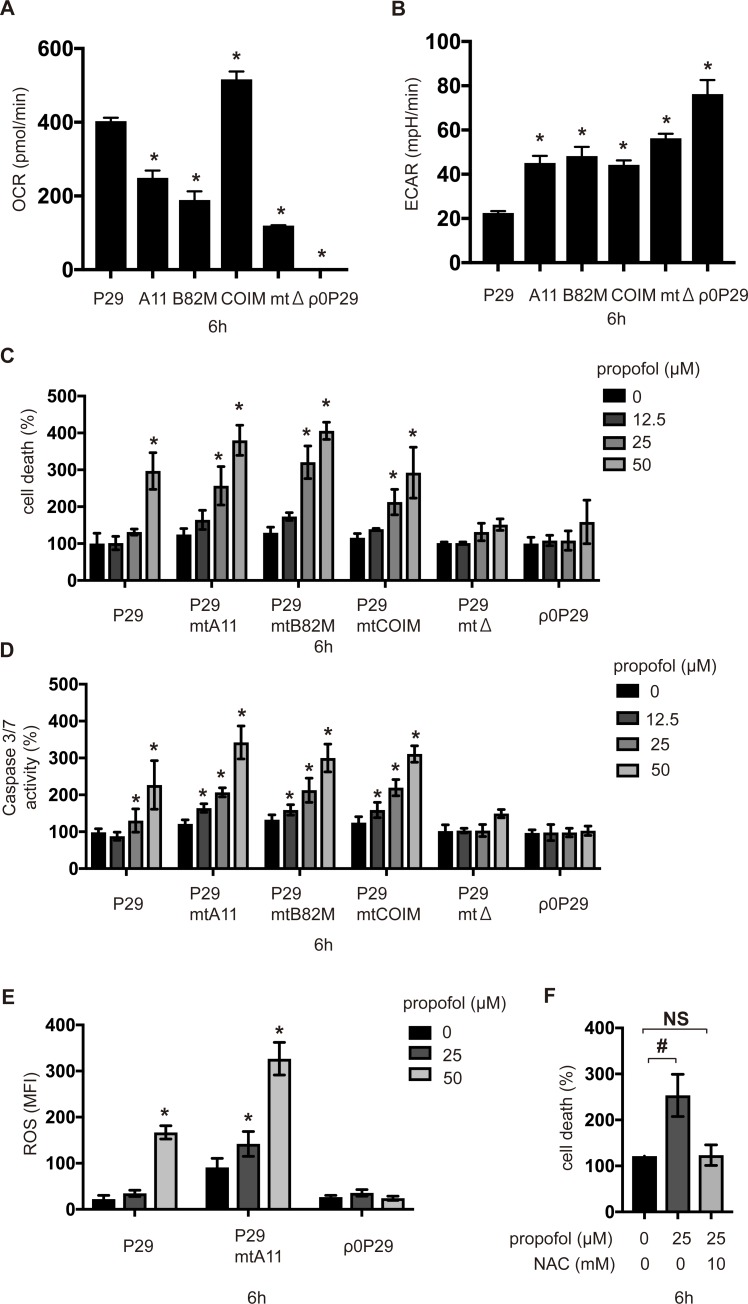
Fig 7. Effects of propofol on caspase activity and cell death in various transmitochondrial cybrid cells.
(A) OCR and (B) ECAR of P29, its cybrid cells, and ρ0P29 cells. (C and D) P29, its cybrid cells, and ρ0P29 cells were exposed to the indicated concentrations (12.5, 25, or 50 μM) of propofol for 6 h. Cells were harvested, and percentages of cell death were measured by flow cytometry. The ratio of PI-positive and/or annexin V-positive cells [(Q1 + Q2 + Q4)/(Q1 + Q2 + Q3 + Q4)] was used to calculate the percentage of dead cells (n = 3) (S1 Fig) (C). Caspase-3/7 activity in each treatment group were assayed (n = 3) (D). (E) P29, P29mtA11 and ρ0P29 cells were exposed to 25 or 50 μM propofol for 6 h and subjected to ROS assay. (F) P29mtA11 cells were exposed to 25 μM propofol with or without 10 mM NAC for 6 h. Cells were harvested, and percentages of cell death were measured by flow cytometry. Data presented in (A–F) are expressed as the mean ± SD. Differences between treatment groups were evaluated by one-way ANOVA, followed by Tukey's multiple comparison test (A and B), by Dunnett’s multiple comparison (E and F) or by two-way ANOVA, followed by Tukey's multiple comparison test (C and D). *p < 0.05 compared to the control cell population; #p < 0.05 compared with the indicated groups. A11: P29mtA11 cells; B82M: P29mtB82M cells; COIM: P29mtCOIM cells; mtΔ: P29mtΔ cells.

