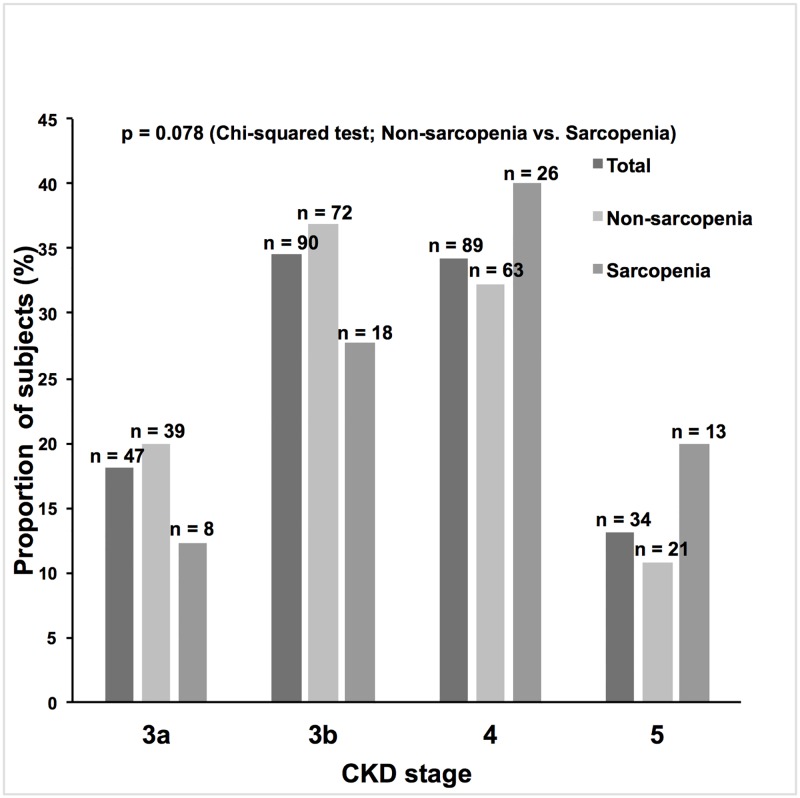
Fig 1. The overall proportions of subjects in each chronic kidney disease (CKD) stage (3a: eGFRcr 45–59 ml/min/1.73 m2; 3b: eGFRcr 30–44 ml/min/1.73 m2; 4: eGFRcr 15–29 ml/min/1.73 m2; 5: eGFRcr <15 ml/min/1.73 m2).
The difference in proportions of subjects in each CKD stage was examined using chi-squared test (the non-sarcopenia group vs. the sarcopenia group). Although the proportion of subjects with advanced CKD stages seemed to be higher in the sarcopenia group than in the non-sarcopenia group, no statistically significant difference was observed (P-value 0.078).

