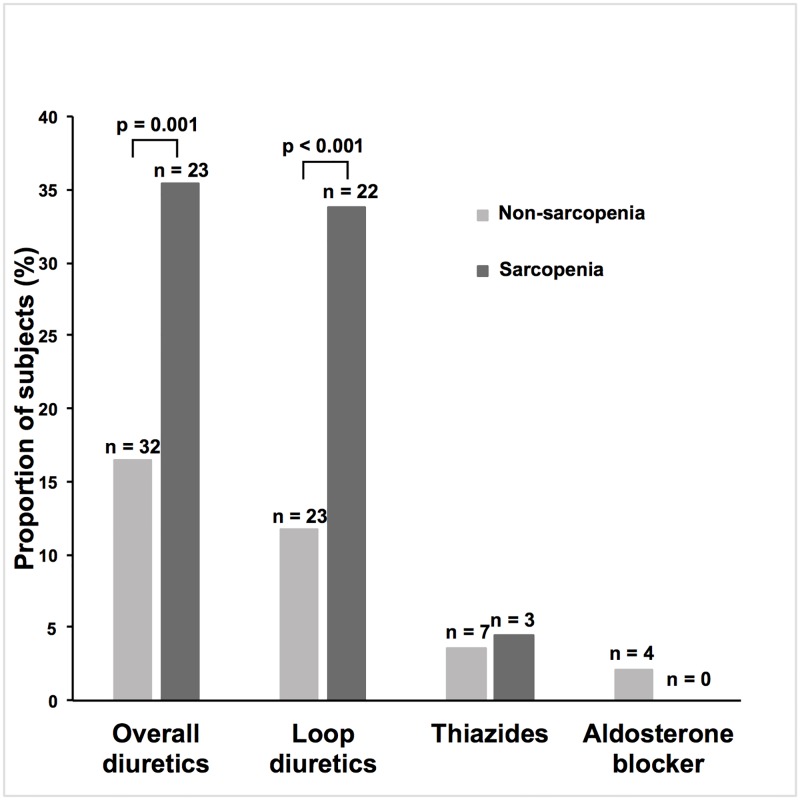
Fig 3. The overall proportions of subjects using each class of diuretic.
The differences in proportions of subjects using each class of diuretic were examined using chi-squared test. The proportion of subjects treated with any class of diuretic was higher in the sarcopenia group (P-value 0.001). When different classes of diuretic were analyzed, the proportion of subjects treated with loop diuretics was higher in the sarcopenia group (P-value <0.001).

