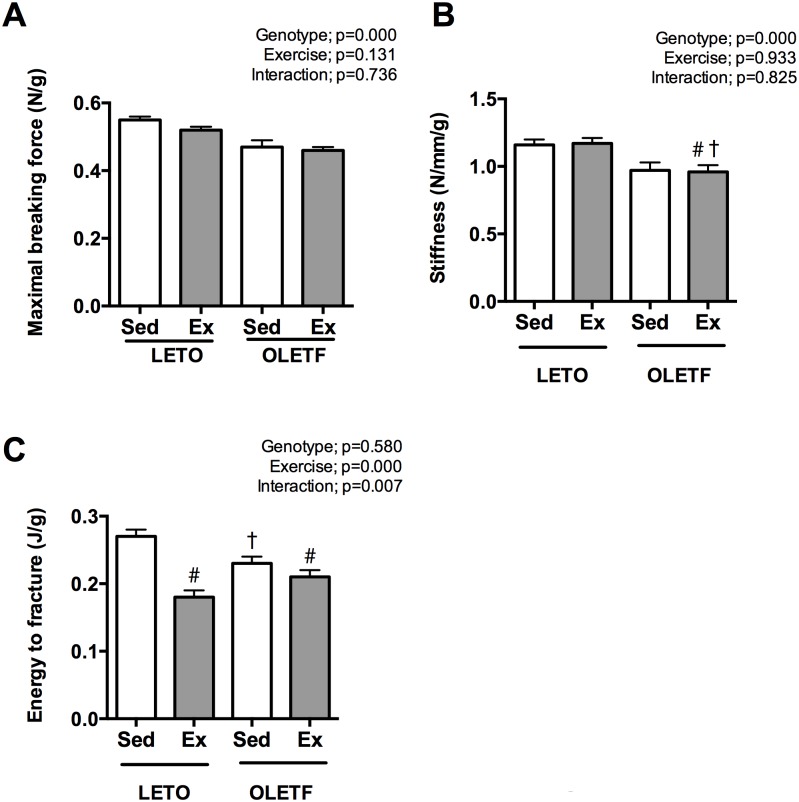
Fig 2. The bone mechanical properties of the rats at 25 weeks of age.
Maximum breaking force (A) and stiffness (B) were lower in OLETF rats. In contrast, energy to fracture was not different between genotype. All values are presented as the mean ± SEM. * p<0.05 vs. all; † p<0.05 vs. L-Sed; # p<0.05 vs. L-Ex.

