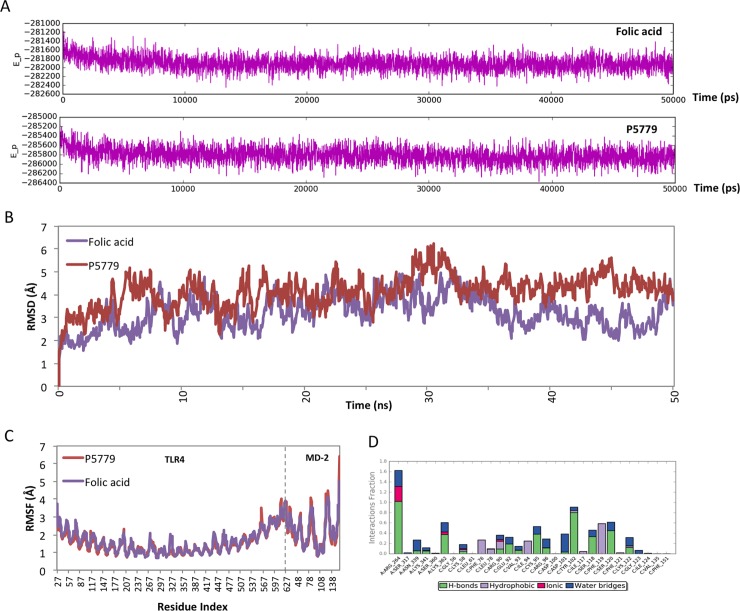
Fig 3. MD simulation trajectory (50 ns) analysis of P5779 and folic acid with TLR4/MD-2 complex.
(A) The potential energy plots showing the relatively stable complex system. (B) RMSD plot representing small deviation along the stable region preceded by small rearrangement from the initial conformation. (C) RMSF graph representing the extent of conformational arrangement upon P5779 and folic acid binding to TLR4/MD-2 complex. (D) Protein-ligand contacts during the folic acid/TLR4/MD-2 simulation.

