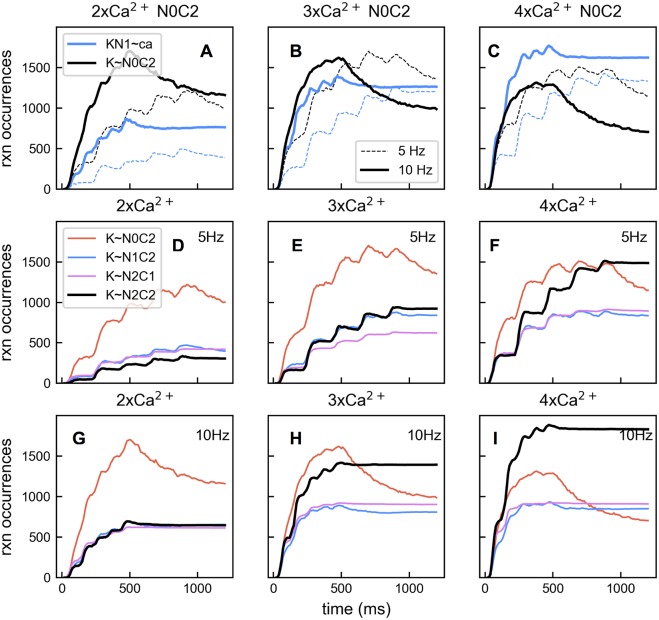
Fig 11. Change of pathway choice as Ca2+ influx increases.
(A) With 2× Ca2+ input, reaction occurrences of CaM N0C2 binding Ca2+ at the N1 site (blue) and directly binding with CaMKII (black). Thick lines are for 10 Hz input, and thin lines are for 5 Hz input. (B) The same as in A except that 3× Ca2+ influx is given. (C) The same as in A except that 4× Ca2+ influx is given. (D-F) Accumulated reaction occurrences for major CaM CaMKII binding reactions with varying amount of total Ca2+ influx from 2×, 3× to 4×, with Ca2+ input delivered at 5 Hz. (G-I) The same as in D-F except that Ca2+ input is delivered at 10 Hz.

