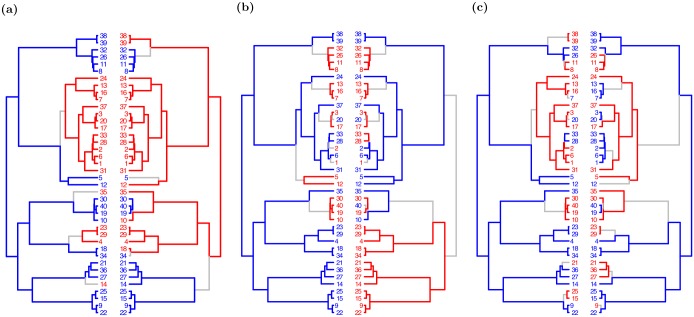
Fig 1. Evolutionary scenarios detected by treeWAS scores.
The three complementary tests of association in treeWAS assign high scores to different patterns of association, examples of which are illustrated above. Each panel displays the phenotype (left) and the genotype of one associated locus (right), with binary states plotted along the tips of the phylogenetic tree (N = 40) and reconstructed ancestral states indicated along the branches of the tree (blue = 0, red = 1, grey = substitution). A: Score 1 aims to detect association among terminal nodes and assigns a relatively high value of 0.7 to this terminal configuration of phenotypic and genotypic states. B: Score 2 measures association by counting how many branches contain a substitution in both genotype and phenotype, assigning this pattern a score of 5. C: Score 3 is designed to find associations maintained loosely across the phylogenetic tree, resulting in a Score 3 value of 10 to this scenario.

