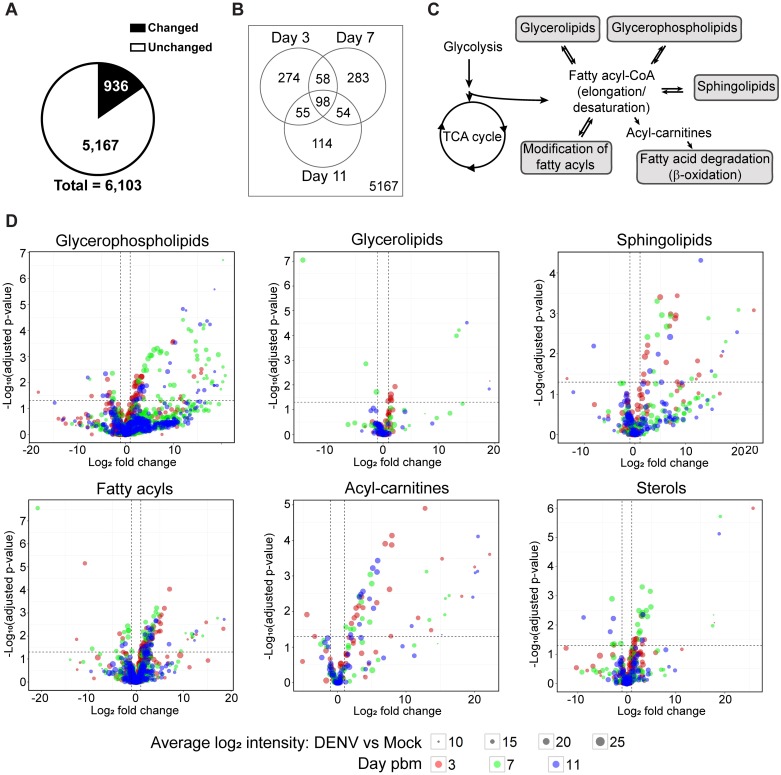
Fig 2. Metabolic profile of the mosquito midgut during the course of DENV infection.
Significant changes were observed in the metabolic profile of the midgut upon infection. (A) The pie chart shows numbers of features in the midgut detected on days 3, 7 and 11 following a DENV-infectious blood meal compared to a noninfectious blood meal with significantly altered levels of abundance (|log2 fold change| ≥ 1 and p-value < 0.05) in black and nonsignificantly altered levels of abundance (|log2 fold change| < 1 or p-value ≥ 0.05) in white. (B) Venn diagram shows numbers of features that were altered in abundance in DENV-infected midguts compared to uninfected midguts on the days 3, 7, and 11 pbm. (C) Overview of lipid classes observed in this study and their relationship to each other within metabolic pathways. Fatty acyl-CoAs can be de novo synthesized from intermediates in central carbon metabolism. They can be further modified or incorporated into several classes of more complex lipids or converted to acyl-carnitine for energy production. (D) Volcano plots show the abundances of metabolites from different classes of lipids detected on days 3, 7 and 11 pbm in DENV-infected versus uninfected midguts. The vertical dashed lines indicate a 2-fold change in abundance and the horizontal dashed line indicates a p-value = 0.05.

