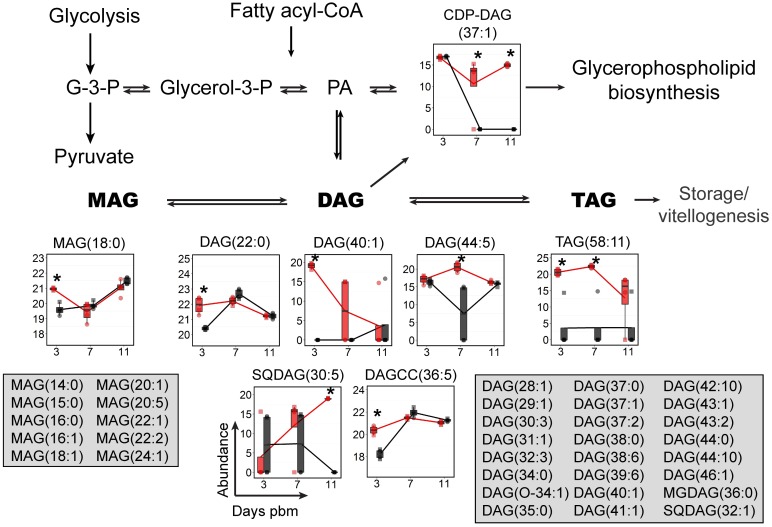
Fig 4. GL levels were dynamically altered upon DENV infection of mosquito midguts.
The abundances of GL species detected in mosquito midguts were mapped to the GL biosynthesis pathway. GL molecules that were significantly altered in abundance are shown in boxplots. Feature that were detected but did not change in abundance are listed in the grey boxes. The abundance of metabolites detected in DENV-infected samples is shown in red and uninfected samples in black. Individual sample pools are represented by circles and squares and technical replicates are dots with the same symbol. Asterisk (*) indicates significantly different levels of abundance between DENV-infected and uninfected samples (|log2 fold change| ≥ 1, p < 0.05) Abbreviations: DAG, diacylglycerol; CDP-DAG, cytidine diphosphate diacylglycerol; G-3-P, glyceraldehyde-3-phosphate; glycerol-3-P, glycerol-3-phosphate; MAG, monoacylglycerol; PA, phosphatidic acid; TAG, triacylglycerol; SQDAG, Sulfoquinovosyldiacylglycerol and DAGCC, diacylglycerylcarboxy-N-hydroxymethyl-choline.

