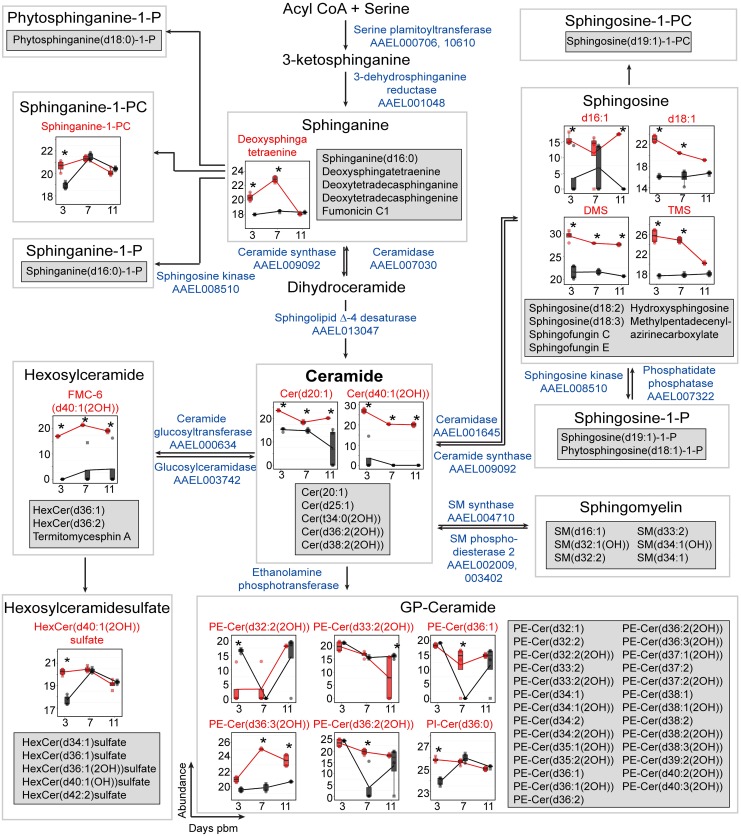
Fig 5. Accumulation of SPs during DENV infection.
The SP pathway for Ae. aegypti was reconstructed for the first time in this study. This SP metabolic pathway (modified from Hannun et al., 2008 [38]) is shown overlaid with box plots with SPs that exhibited significantly altered levels during infection. Features that were detected but unchanged in abundance upon DENV infection are listed in the grey boxes. The abundance of metabolites detected in DENV-infected samples is shown in red and uninfected samples in black. Individual sample pools are represented by circles and squares and technical replicates are dots with the same symbol. Asterisks (*) indicates significantly different levels of abundance between DENV-infected and uninfected samples (|log2 fold change| ≥ 1, p < 0.05). The enzymes predicted to catalyze the reactions in the SP pathway and their VectorBase accession numbers (AAELXXXXXX) according to AaegEL5 assembly and as annotated in the KEGG pathway are given in blue text. Where enzymes are not given it indicates an absence of annotation for Ae. aegypti of names via the KEGG database and VectorBase. Abbreviations: Cer, ceramide; GP-Cer, glycerophospholipid-ceramide; HexCer, hexosylceramide; FMC-6, acetyl-sphingosine-tetraacetyl-GalCer(d40:1(2OH)); PE-Cer, phosphatidylethanolamine-ceramide; Phytosphinganine-1-P, phytosphinganine-1-phosphate; PI-Cer, phosphatidylinositol-ceramide; Sphingosine-1-P, sphingosine-1-phosphate; Sphingosince-1-PC, sphingosine-1-phosphatidylcholine and SM, sphingomyelin.

