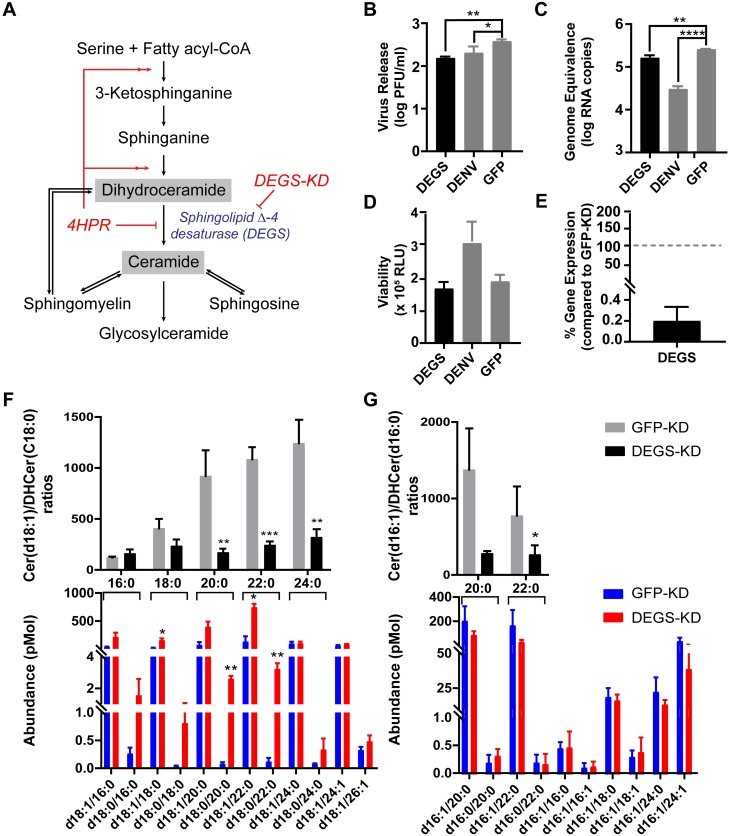
Fig 6. Changes in the Cer-DHCer balance impair DENV infection in Aag2 cells.
(A) A schematic of the SP biosynthesis pathway showing the precursor (DHCer) and product (Cer) of the sphingolipid Δ-4 desaturase (DEGS) enzyme-catalyzed reaction. In this experiment, the Cer/DHCer balance was changed by dsRNA knockdown of the DEGS gene expression as well as pharmacological inhibition of DEGS with 4HPR (S2 Fig). (B and C) Aag2 cells were transfected with dsRNA derived from DEGS, DENV (positive control) or GFP (negative control) genes. Two days post transfection, cells were infected with DENV at 0.3 MOI. Cell culture supernatant (B) or intracellular total RNA (C) were collected at 24 hours post infection (hpi) and analyzed for infectious virus in medium and intracellular DENV RNA, respectively. One-way ANOVA followed by Dunnett’s multiple comparisons test were used for statistical analysis. (D) Viability of Aag2 cells after dsRNA treatments at 48 h post dsRNA transfection. (E) DEGS mRNA expression in DEGS-KD cells compared to the expression of the DEGS mRNA in GFP-KD cells (set at a 100%). (F and G) Analysis of Cer and DHCer species in DEGS-KD (red) and GFP-KD cells (blue) using LC-MS/MS Multiple Reaction Monitoring (N = 3). (F) and (G) shows Cer and DHCer molecules with 18- and 16-carbon long chain sphingoid bases, respectively. Lower panels show the abundance of individual species of Cer(d18:1/xx:x or d16:1/xx:x) or DHCer(d18:0/xx:x or d16:0/xx:x) where xx:x refers to the fatty acyl chain attached to each sphingoid head group. The upper panels show the ratio of Cer/DHCer species with the same fatty acyl chain lengths. These ratios highlight the Cer-DHCer imbalance caused by manipulation of DEGS gene expression. Student’s t-test was applied for statistical analysis. * p < 0.05, ** p < 0.01, *** p < 0.005, **** p < 0.001.

