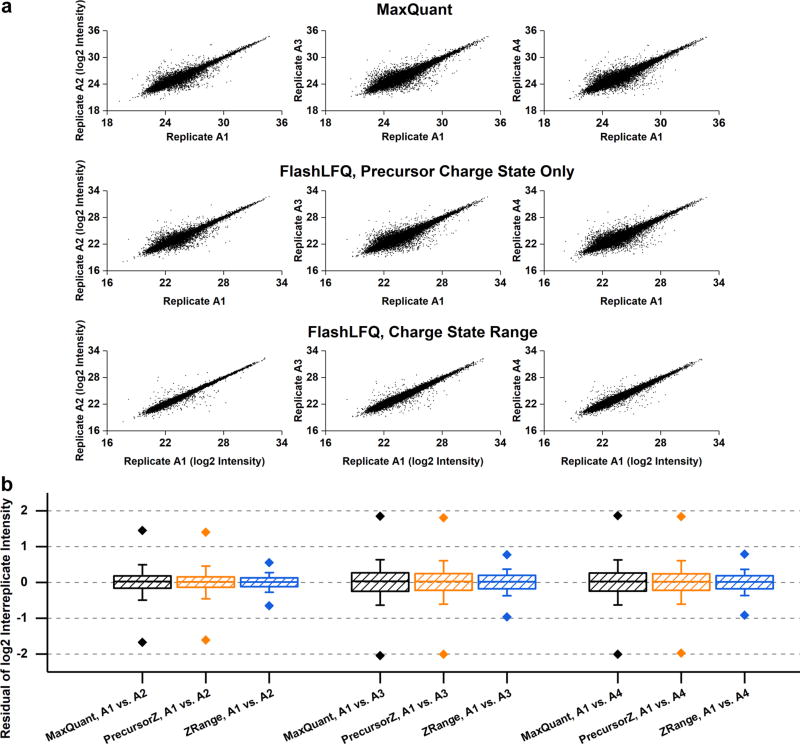
Figure 2.
(a) Plots of replicate-to-replicate log2-transformed intensity per peptide. Only peptides quantified in both files were plotted. Replicate A1 is compared with A2, A3, and A4 with either MaxQuant (top) or FlashLFQ using only the precursor’s charge state (middle) or across a charge state range (bottom). (b) Boxplots of replicate-to-replicate residuals of log2 intensities. Replicate A1 is compared with A2, A3, and A4 with either MaxQuant (black) or FlashLFQ using only the precursor’s charge state (orange) or across a charge-state range (blue). Box boundaries indicate 25th and 75th percentiles; whiskers indicate one standard deviation; diamonds indicate 1st and 99th percentiles.

