. 2018 Feb 15;7:e33322. doi: 10.7554/eLife.33322

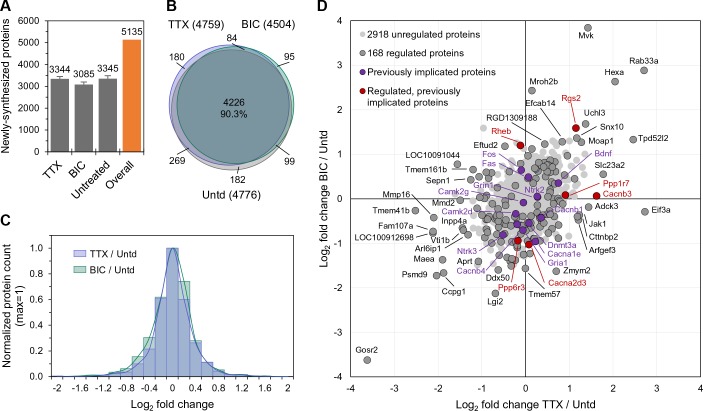
Figure 1. The newly synthesized proteome after 2 hr of enhanced or reduced activity.

(A) Bar chart showing the number of newly synthesized proteins identified on average, in each group as indicated. Error bars represent ±SEM of 5 biological replicates. (B) Venn diagram indicating the number (in parentheses) and overlap of proteins expressed in each treatment group (TTX or bicuculline) and untreated control. (C) Protein fold changes (Log2) showing the overall proteome regulation each treatment group compared to untreated samples. (D) Scatter plot showing all significantly regulated proteins (dark grey; n = 168; ANOVA, FDR = 0.05) as well as the regulation of proteins previously implicated in homeostatic scaling (red). Proteins shown in light grey or purple are not significantly regulated.

Figure 1.

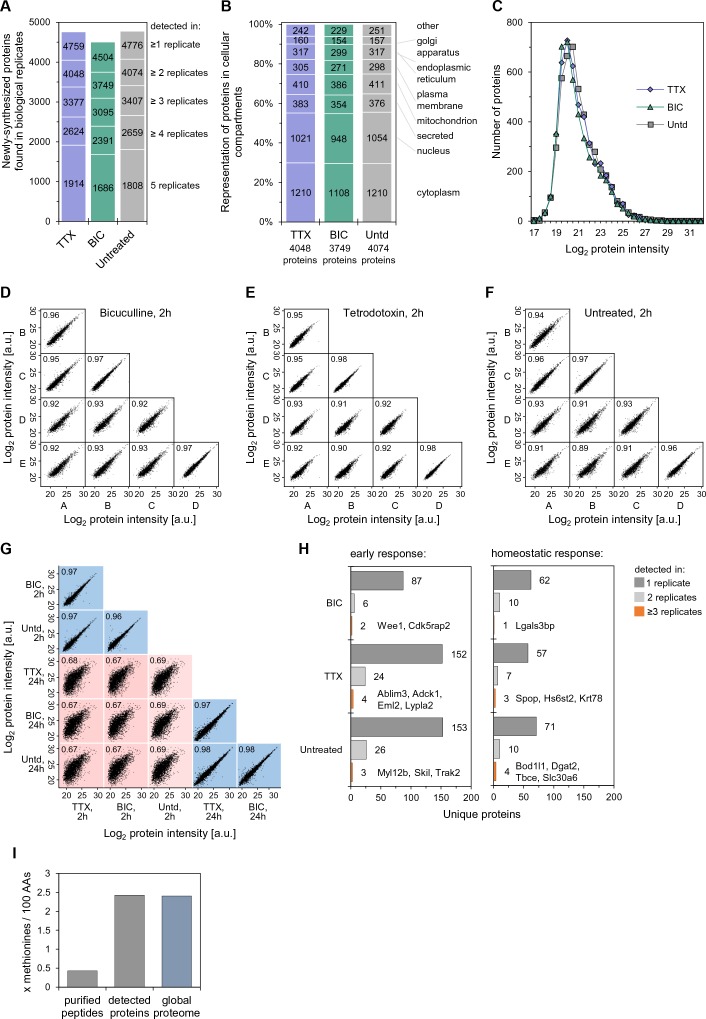
Figure 1—figure supplement 1. Data reproducibility and overlap of the newly synthesized proteome (2 hr).

Figure 1—figure supplement 1.

(A) Bar chart representing the reproducibility of proteins identified in several biological replicates. Proteins identified in only one replicate were discarded and not analyzed further. (B) Newly-synthesized proteins in each treatment group were classified according to their localization in cellular compartments using Gene Ontology. (C) Distribution of non-normalized, raw protein intensities showing similar protein expression in all conditions. (D–F) Correlation plots of protein intensities across biological replicates for the 2 hr datasets for each treatment, TTX, bicuculline or untreated (control), respectively. (G) Correlation plots of protein intensities for the data sets acquired in this study (2 hr) as well as the data sets in a previous study (Schanzenbächer et al., 2016) that is further analyzed here. In order to be plotted here, the protein must be identified in the two experiments being compared. (H) The unique proteins identified in a single treatment group, showing the number of replicates in which the protein was identified. (I) The methionine content of the peptides identified in our study, proteins identified in our study and the global proteome (from UniprotKB).