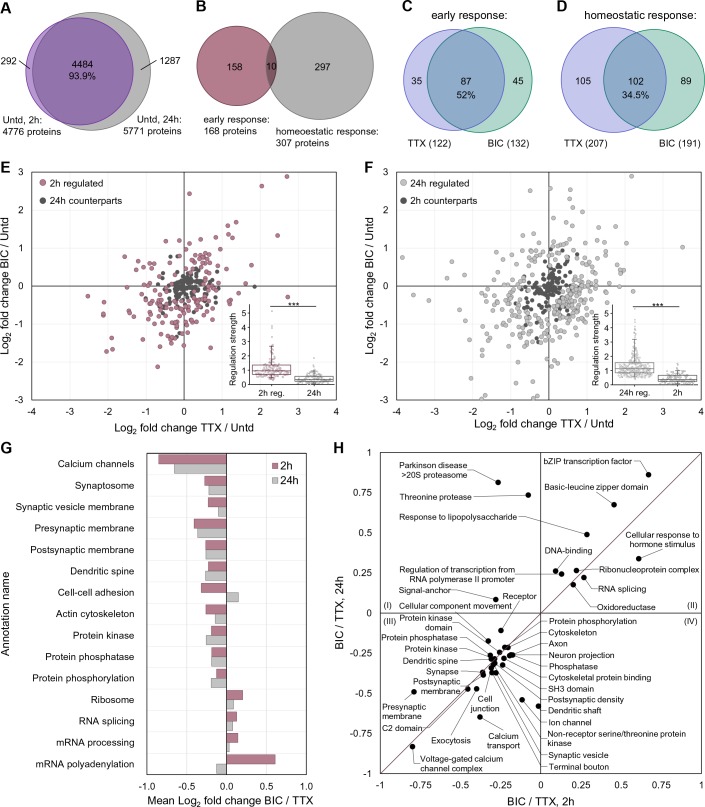
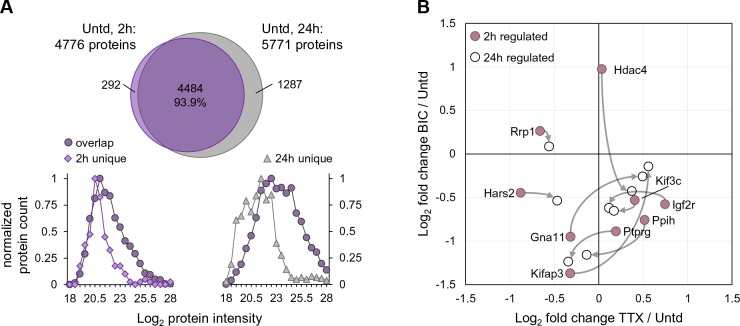
Figure 4. A comparison of proteome remodeling in neurons after 2 hr and 24 hr of synaptic scaling.
(A) Venn diagram showing the overlap of proteins expressed in untreated neurons for 2 hr and 24 hr. (B) Venn diagram showing the overlap of the significantly regulated proteins following 2 hr or 24 hr of synaptic scaling. (C) Venn diagram showing the overlap of the proteins significantly regulated by TTX and bicucculine treatment after 2 hr. The total number of regulated proteins for each group is in parentheses. (D) Venn diagram showing the overlap of the proteins significantly regulated by TTX and bicucculine treatment after 24 hr. The total number of regulated proteins for each group is in parentheses. (E) Scatter plots showing the regulated proteins at 2 hr (mauve dots) and their corresponding regulation at 24 hr (black dots). Inset shows the median regulation strength for the same set of proteins. (F) Scatter plots showing the regulated proteins at 24 hr (grey dots) and their corresponding regulation at 2 hr (black dots). Inset shows the median regulation strength for the same set of proteins. (G) Functional annotation of protein groups showing that, although overlapping individual regulated proteins are rare at 2 and 24 hr, there are similar protein groups that exhibit differential regulation between the up- and down-scaling treatment. (H) More detailed functional characterization of the protein groups that are similarly regulated at 2 and 24 hr.


