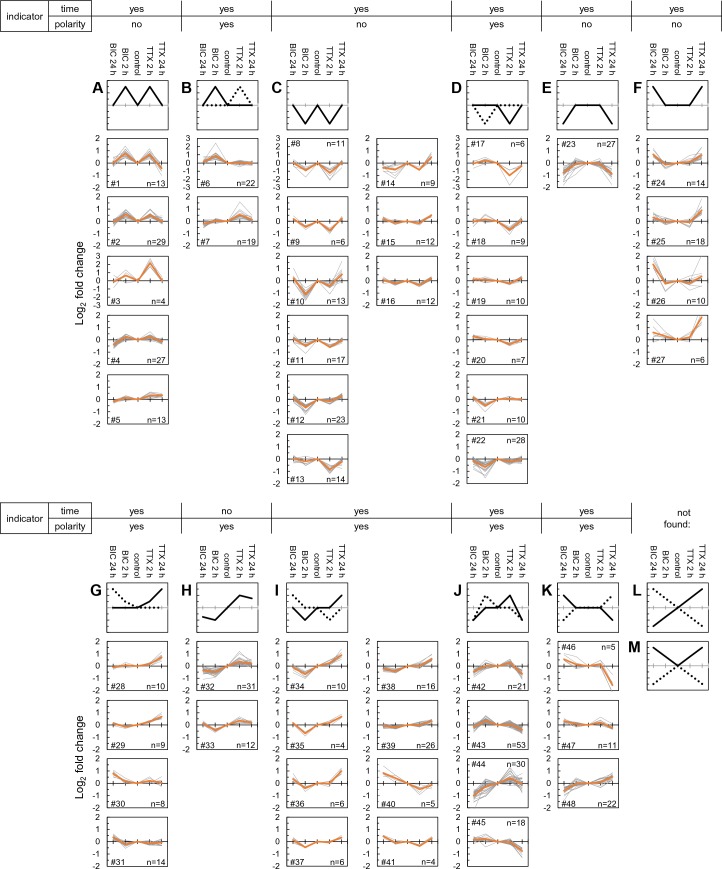
Figure 6. Self-organizing maps define clusters of time- and polarity-dependent proteome regulation.
(A–M) Shown are clusters of regulated protein expression profiles obtained using self-organizing maps. Along the top of the clusters, whether or not the expression profile indicates the time the system has been manipulated (e.g. 2 or 24 hr) or the type of manipulation (up- or down-scaling). (A) The ‘M’ profile, represented by five clusters and a total of 86 different proteins. (B) The modified ‘M’ profile, represented by 2 clusters and 41 different proteins. (C) The ‘W’ profile, represented by nine clusters and a total of 117 different proteins. (D) The modified ‘W’ profile, represented by 6 clusters and 70 different proteins. (E) The ‘inverted trapezoid’ profile represented by 1 cluster of 27 proteins. (F) The ‘trapezoid’ profile represented by 4 clusters and 48 proteins. (G) The ‘sun-seeking worm’ profile represented by 4 clusters and 41 proteins. (H) The ‘sine wave’ profile represented by 2 clusters and 43 proteins. (I) The ‘skewed W’ profile represented by 8 clusters and 77 proteins. (J) The ‘skewed M’ profile represented by 4 clusters and 122 proteins. (K) The ‘flattened trapezoid’ profile represented by 3 clusters and 38 proteins. (L and M) Two profiles that we did not identify in our population of newly synthesized proteins include the ‘diagonal lines’ or the ‘regular or inverted V’.


