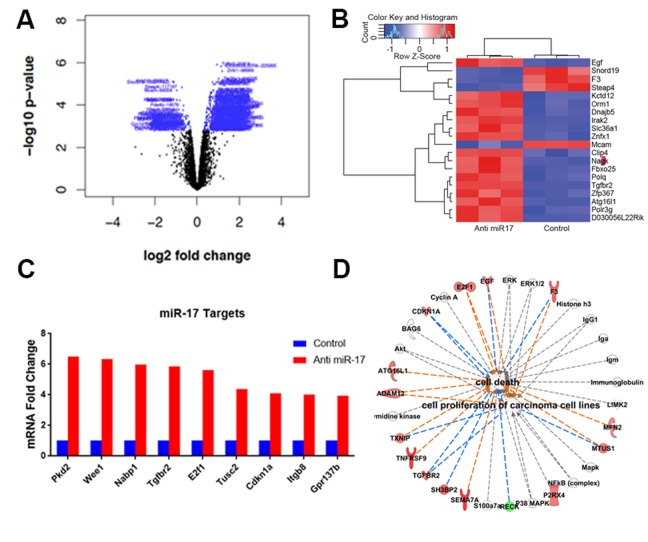
Figure 5. Anti-miR-17 therapy leads to de-repression of miR-17 targets.
A. Volcano plot shows genes differentially expressed with anti-miR-17 treatment. Genes colored in blue represent the differentially expressed genes. B. Heat map of the top 20 genes differentially expressed upon treatment with control versus anti-miR-17 oligonucleotide. C. De-repression of several known targets of miR-17 was seen including E2f1, Tgfbr2 and Cdkna1 in tumors treated with anti-miR-17 therapy. D. Pathway analysis of differentially expressed genes revealed that enhancement of cell death and inhibition of cellular proliferation (p=1.9X10⁻⁵) were key functional changes induced by anti-miR17 therapy. The lines in orange represent inhibition and the lines in blue show activation.

