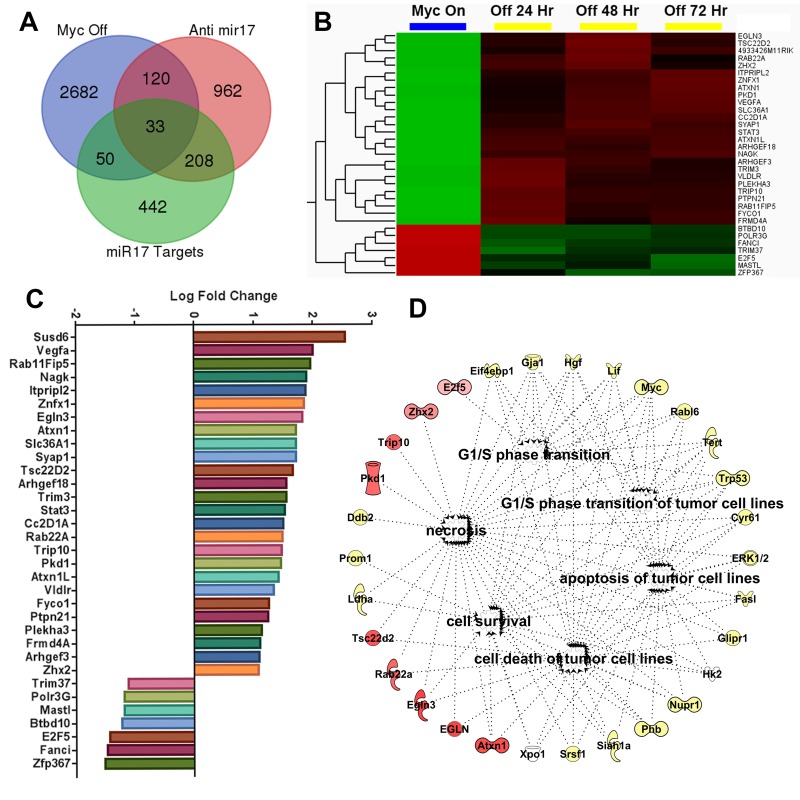
Figure 6. Anti-miR-17 therapy inhibits MYC induced transcriptional program.
A. Venn diagram showing overlap of three separate gene sets i) Genes differentially expressed in conditional cell lines when MYC is inactivated ii) genes differentially expressed in MYC conditional cell lines when treated with anti-miR-17 therapy iii) Genes that are identified to be targets of miR17 on Targetscan analysis. B. Heatmap shows expression of the 33 genes identified as overlapping between above 3 gene sets in MYC ON versus OFF states. C. Bar graph shows log fold change of expression changes of these 33 genes in cell lines treated with control versus anti-miR-17 therapy. D. Network analysis of the 33 genes revealed the most activated pathways were cell death and survival, cell cycle regulation and apoptosis. The molecules in red are the most over expressed in the tumors treated with anti-miR-17 therapy while the other molecules in yellow are indirectly involved in the network.

