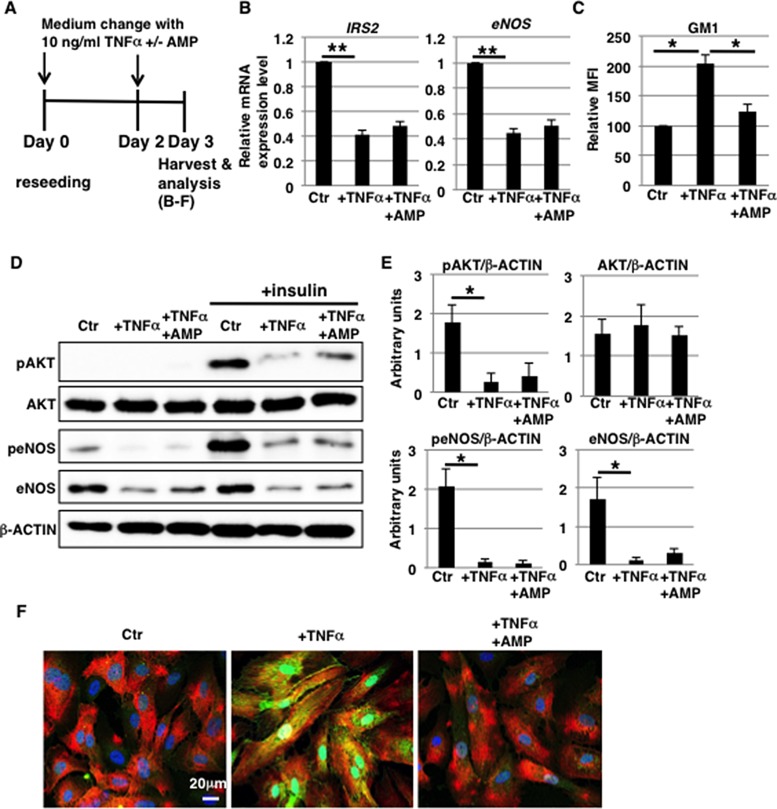
Figure 5. eNOS activation is attenuated independently of GM1 in 10 ng/ml TNFα-treated HAECs.
(A) At day 0, cells were reseeded with 10 ng/ml TNFα and with or without AMP-dNM in HAEC medium and incubated for 3 days. At day 3, cells were harvested and analyzed (B–F). Control cells were grown in HAEC medium. (B) Real-time PCR analysis of IRS2 and eNOS performed using cDNA derived from control and TNFα-treated HAECs with or without AMP-dNM treatment. The results shown were normalized against the values obtained for control HAECs (value = 1). (C) Cell surface levels of GM1 in TNFα-treated HAECs with and without AMP-dNM treatment analyzed by flow cytometry. MFIs relative to control HAECs of three independent experiments are shown. (D) Western blot analysis of insulin signaling performed for TNFα-treated HAECs with or without AMP-dNM treatment. (E) Histograms show mean densitometric readings ± SD of phosphorylated or non-phosphorylated proteins in insulin-stimulated cells normalized to loading controls (β-ACTIN). All values were obtained from three independent experiments. (F) Immunocytochemical staining performed in TNFα-treated HAECs with or without AMP-dNM treatment. Representative images are shown (GM1, green; IRα, red; DAPI, blue; GM1 and IRα co-localization, yellow). *P < 0.05; **P < 0.01. Control (Ctr): untreated cells.

