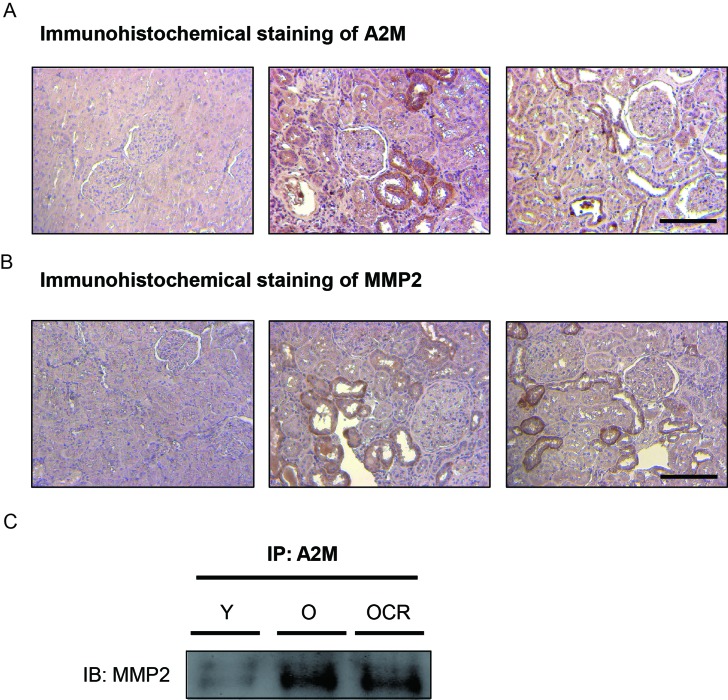
Figure 3. Effects of aging and CR on A2M-MMP2 interaction.
(A) The expression of A2M is visualized by immunohistochemical methods. A2M was dyed brown in color in young, aged, and CR kidney tissue sections via immunohistochemistry. Slides were counter-stained with haematoxylin in blue. Scale bar = 50 μm. (B) The expression of MMP2 is visualized by immunohistochemical methods. A2M was dyed brown in color in young, aged, and CR kidney tissue sections via immunohistochemistry. Slides were counter-stained with haematoxylin in blue. Scale bar = 50 μm. (C) The interaction between A2M and MMP2 was detected by immunoprecipitation.

