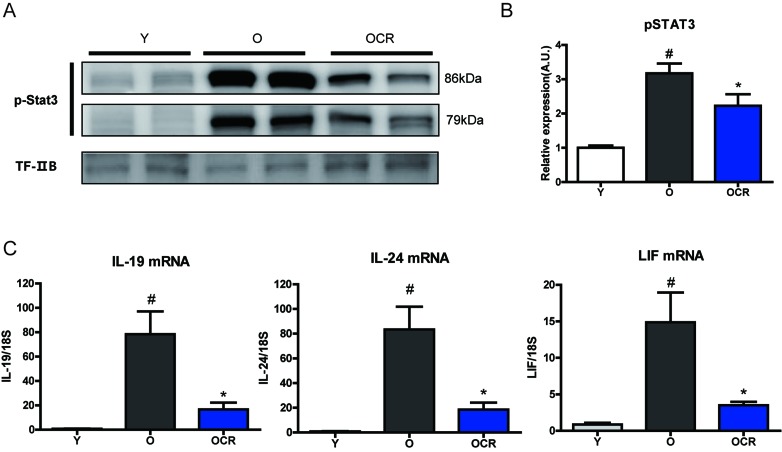
Figure 6. Effects of aging and CR on STAT3 activation and STAT3 inducing cytokines.
(A) Phosphorylated (activation form) STAT3 is detected by Western blotting in the nuclear fraction of kidney. The blots were quantified by densitometry (n = 8). TFIIB was used as the loading control. (B) The blots in figure 6A were quantified by densitometry (n = 8). #P < 0.05 vs young. *P < 0.05 vs old. (C) Gene expressions of IL-19, IL-24, and LIF were detected by qPCR. mRNA levels were normalized to the 18S level. #P < 0.05 vs young. *P < 0.05 vs old.

