
Figure 4. Association between the TERT –245T>C polymorphism and BRAF V600 mutation.
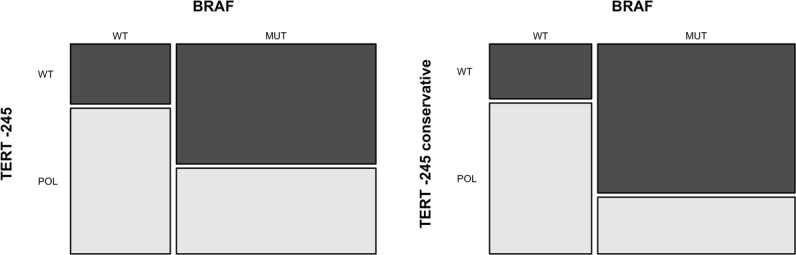
The mosaic-plot shows an inverse association between BRAF V600 mutation and TERT –245 polymorphism in primary melanoma samples (A). This association is stronger when only samples without concurrent TERT promoter pathogenic mutations are analyzed (B) TERT –245 conservative = samples harboring TERT –245T>C polymorphism without concurrent TERT promoter pathogenic mutations. MUT= mutated samples; WT = wild-type samples; POL = samples with TERT –245T>C polymorphism ; WT = samples without TERT –245T>C polymorphism.