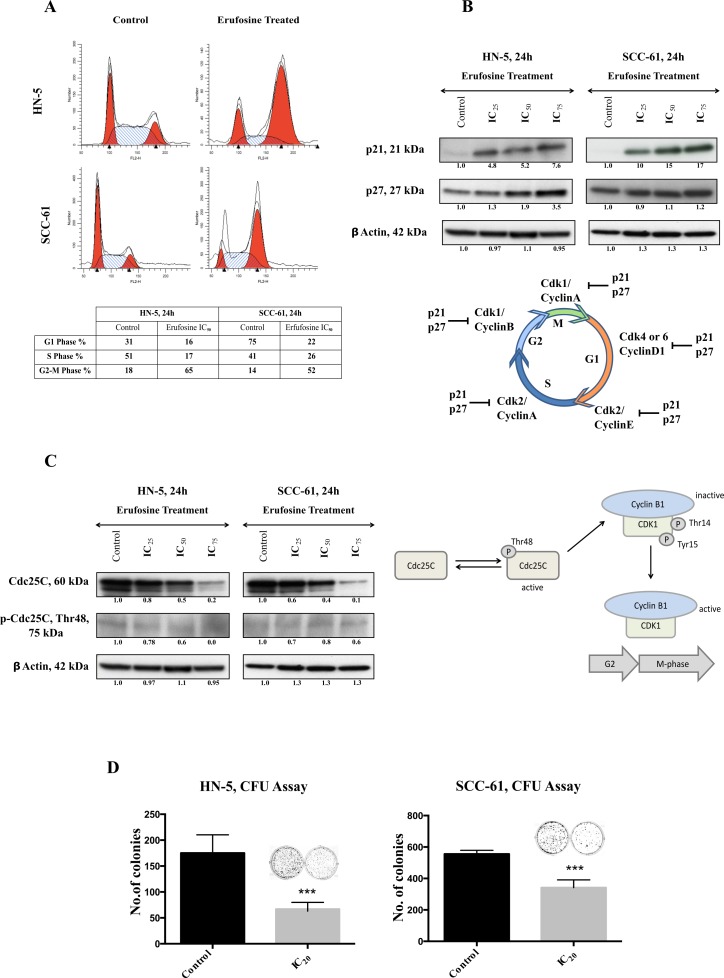
Figure 4.
(A) Cell cycle analysis of HN-5 and SCC-61 post 24 h of erufosine treatment. Both cell lines were treated with IC50 concentration of the drug and analyzed by PI staining. Both cell lines show a G2/M block. Cell fractions (%) from different phases of the cell cycle are given in the table below the figure. Ten thousand cells (events) per sample were analyzed to study distribution of the cells. (B) The protein expression of p21 and p27 in response to erufosine exposure in HN-5 and SCC-61 cells. An increase in expression was seen in both p21 and p27 levels. (C) Protein expression of Cdc25C and p-Cdc25C Thr48 in response to erufosine exposure post 24 h in HN-5 and SCC-61 cells. A dose dependent decrease in protein levels was observed. Protein level changes were deduced by dividing the densitometry output for each band by that for the corresponding β-actin band. (D) Inhibition of colony formation by erufosine: Significant anti-clonogenic effects were observed in HN-5 and SCC-61 cells after exposure to erufosine at IC20 concentrations. Asterisks denote significant differences (P < 0.05) between the control and treated cells.

