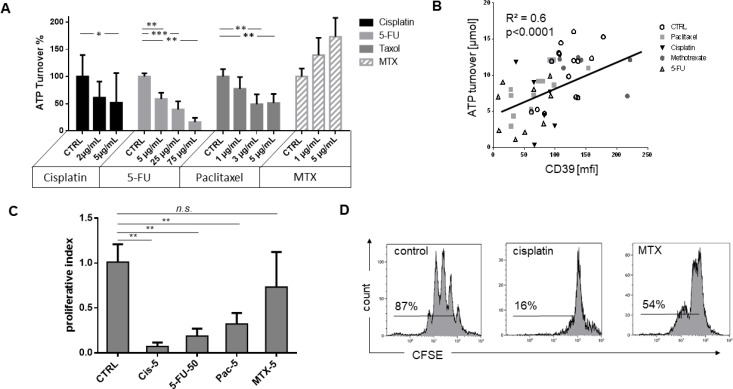
Figure 4. ATP hydrolysis, correlation to CD39 expression, and proliferation of B cells under influence of chemotherapy.
(A) Utilization of exogenous ATP by B cells incubated with 20 µM ATP after 90 minutes detected by luminescence measurement. The data are means ± SD from three or more independent experiments with cells of different HCs each cultured in the presence of one cytostatic drug for 7 days before ATP add-on. Control measurements without treatment are set to 100% on the y-axis. (B) Spearman rank correlation of ATP hydrolysis and CD39 surface expression analyzed by flow cytometry. (C) Proliferation examined by dilution of CFSE: Left, average of at least three independent experiments, normalized to untreated controls; right, representative examples incubated with 1 µg/mL cisplatin and 10 µg/mL methotrexate. (C) Proliferation examined by dilution of CFSE. Average of at least three independent experiments, normalized to untreated controls. (D) representative examples incubated with 1 μg/ mL cisplatin and 10 μg/mL methotrexate.

