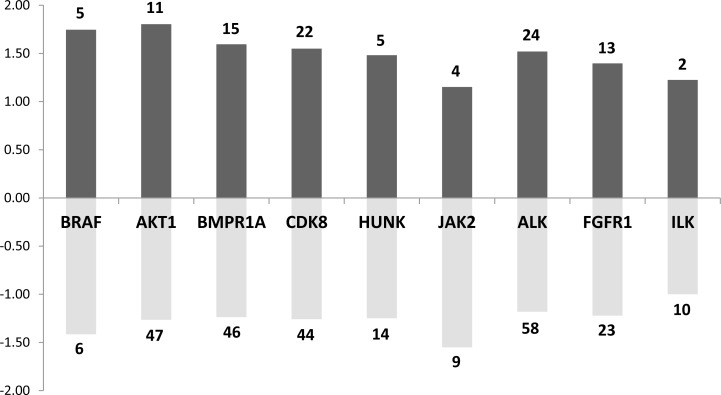
Figure 5. Main kinases whose known targets are dysregulated in both rat and mouse models.
Dark grey bar charts indicate for each kinase the mean fold change of up-regulated target genes. Pale grey bar charts indicate for each kinase the mean fold change of down-regulated target genes. The number of up or down-regulated target genes for each kinase are indicated in the bar charts.

