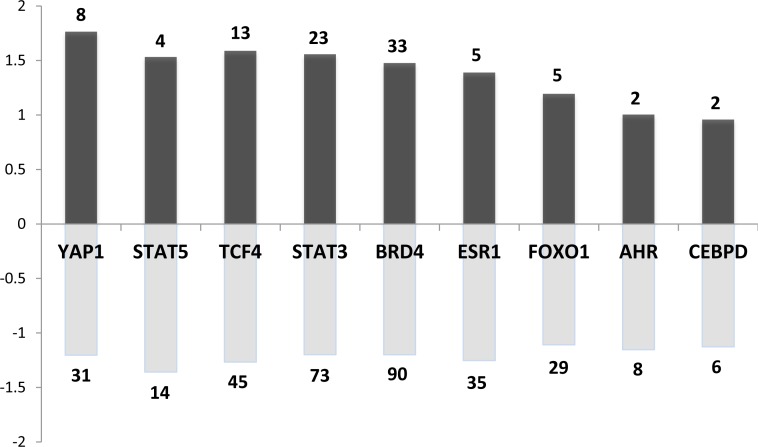
Figure 6. Main transcription factors (TF) whose known targets are dysregulated in both rat and mouse models.
Dark and pale grey bar charts indicate for each TF the mean fold change of up and down regulated target genes respectively. The number regarding the bar chart indicates the number of up or down-regulated target genes for each TF.

