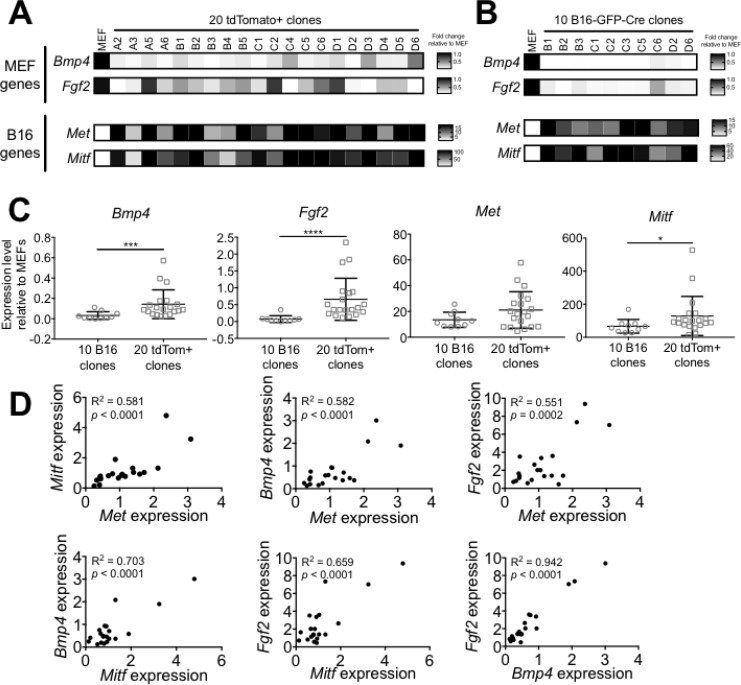
Figure 5. B16xMEF hybrids express B16- and MEF-restricted genes.
(A) Heat map showing the relative expression level of two candidate “MEF genes” (Bmp4, Fgf2) and two candidate “B16 genes” (Met, Mitf) in MEF and twenty tdTomato+ clones. The expression level of each gene is shown as relative to MEF and normalized against Hprt (n = 2 independent experiments). (B) Heat map showing the expression level of Bmp4, Fgf2, Met, and Mitf in ten B16-GFP-Cre clones relative to MEF and normalized against Hprt (n = 2 independent experiments). (C) Comparison of the average expression level of Bmp4, Fgf2, Met, and Mitf in ten B16-GFP-Cre clones and twenty tdTomato+ clones (n = 2–3 independent experiments per data point). Data is represented as mean ± SEM. See also Supplementary Figure 4. (D) Dots plots comparing the expression level of Bmp4, Fgf2, Met, and Mitf (relative to B16-GFP-Cre) in twenty tdTomato+ clones.

