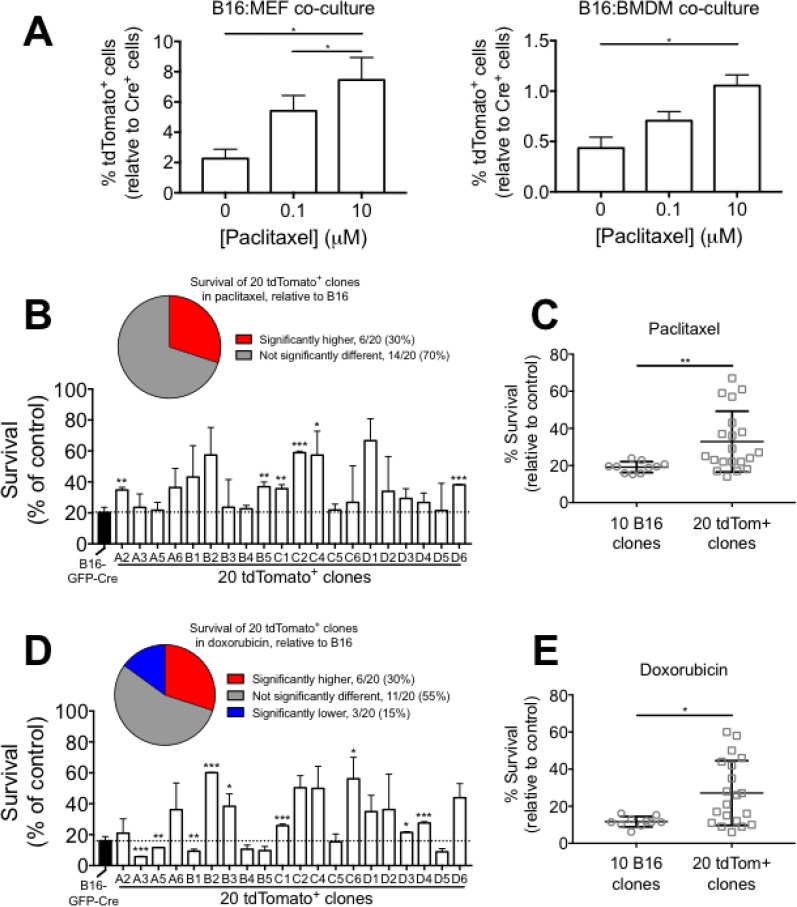
Figure 6. Cell-cell fusion promotes resistance to chemotherapeutics in B16 melanoma cells in vitro.
(A) Quantification of tdTomato+ cells in B16:MEF and B16:BMDM co-cultures grown together for 24 hrs and then treated with 0, 0.1, or 10 μM paclitaxel for 24 hrs (n = 3 independent experiments). Data is represented as mean ± SEM. (B) Bar graph showing survival of B16-GFP-Cre and twenty tdTomato+ clones grown in the presence of paclitaxel (10 μM) for 24 hrs relative to control (n = 2–3 independent experiments). Data are represented as mean ± SEM. (C) Comparison of the average survival rate of ten B16-GFP-Cre clones and twenty tdTomato+ clones in the presence of 10 μM paclitaxel for 24 hrs (n = 2–3 independent experiments). Data are represented as mean ± SEM. (D) Bar graph showing survival of B16-GFP-Cre and twenty tdTomato+ clones grown in the presence of doxorubicin (10 μM) for 24 hrs relative to control (n = 2–3 independent experiments). Data are represented as mean ± SEM. (E) Comparison of the average survival rate of ten B16-GFP-Cre clones and twenty tdTomato+ clones in the presence of 10 μM doxorubicin for 24 hrs (n = 2–3 independent experiments). Data are represented as mean ± SEM.

