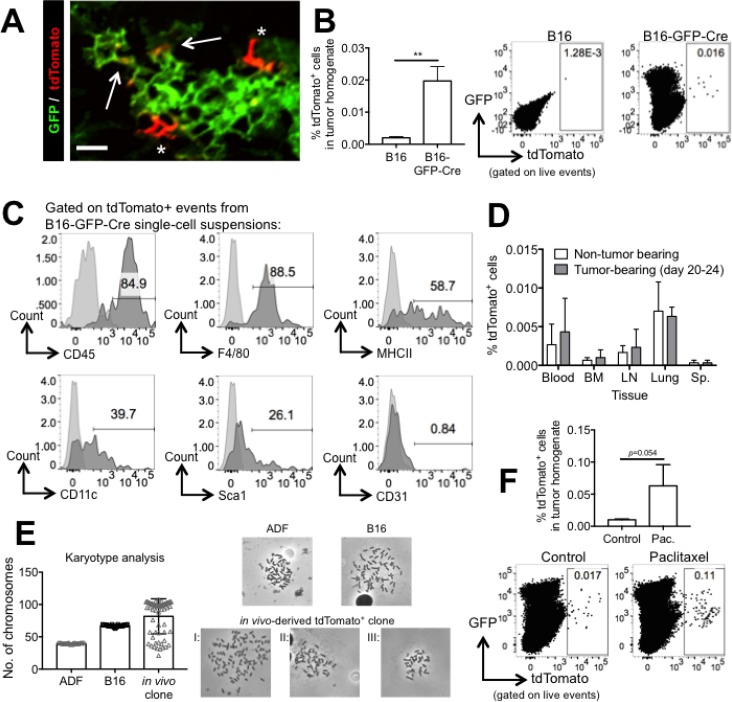
Figure 7. Cre transfer from B16 melanoma cells to non-cancer cells occurs in vivo and promotes survival in the presence of paclitaxel.
(A) Representative confocal micrograph showing GFP and tdTomato expression in a flash-frozen B16-GFP-Cre tumor grown in a reporter mouse for 21 days. Asterisks indicate cells expressing tdTomato, and arrows indicate cells expressing both tdTomato and GFP. Scale bar equals 50 μM. (B) Quantification and representative FACS plots of tdTomato expression in single-cell suspensions of B16 or B16-GFP-Cre tumors that were grown in reporter mice for 18-21 days. n = 4 (B16) or 10 (B16-GFP-Cre) mice. Data are represented as mean ± SEM. (C) FACS analysis of CD45, F4/80, MHCII, CD11c, Sca-1, and CD31 expression on tdTomato+ cells from B16-GFP-Cre single-cell suspensions. Histograms in black were obtained using fluorescently-labeled antibodies against each of the antigens listed, and histograms in light grey were obtained using isotype control antibodies. (D) Quantification of tdTomato expression in single-cell suspensions of various tissues including blood, bone marrow (BM), lymph nodes (LN), lung, and spleen (Sp.) from reporter mice bearing B16-GFP-Cre tumors for 0 or 20–24 days (n = 4 mice per group). Data are represented as mean ± SEM. (E) Karyotype analysis of adult dermal fibroblasts (ADF), B16-GFP-Cre, and an in vivo-derived tdTomato+ clonal cell line. n = 10 (ADF and B16) or 66 (in vivo clone) metaphase spreads per group. Shown is mean ± SD. Representative metaphase spreads of ADF, B16-GFP-Cre and the three types of karyotypes observed in the in vivo clone are shown on the right. See also Supplementary Figure 5. (F) Representative FACS plots and quantification of tdTomato expression in single-cell suspensions of B16-GFP-Cre tumors grown in reporter mice that were treated with HBSS or paclitaxel. Tumors were harvested after reaching a size of 10 × 10 mm2 (n = 6 mice per group). Data are represented as mean ± SEM. See also Supplementary Figure 6.

