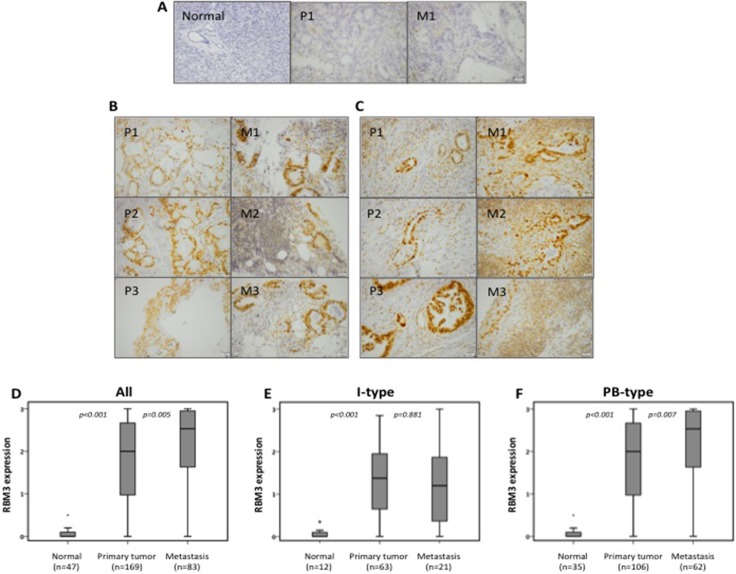
Figure 1. RBM3 expression in primary tumors and lymph node metastases.
Immunohistochemical images of (A) negative RBM3 expression, (B) intermediate RBM3 expression and (C) strong RBM3 expression. A) Negative staining in normal pancreatic tissue and paired intestinal type primary tumour and metastasis. B-C) Pictures represent three paired primary tumors and metastasis from intestinal type tumors (B) and pancreatobiliary-type tumors (C). Box plots visualizing the distribution of RBM3 expression in (D) the entire cohort, (E) intestinal type tumors and (F) pancreatobiliary-type tumors. The images were taken at 20X magnification using cellSens dimension software. Scale bar represents 20 μm.

