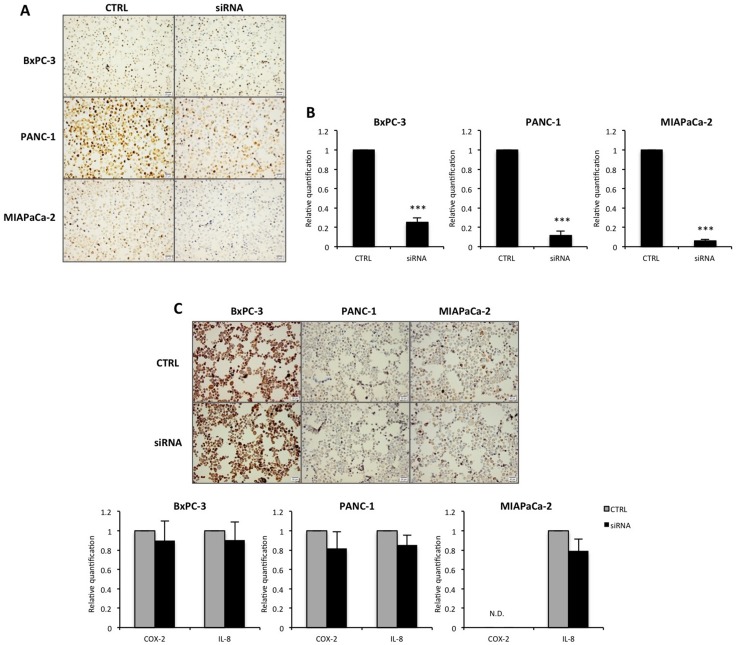
Figure 3. RBM3 mRNA and protein expression after transfection.
(A) Representative images of RBM3 protein expression in pancreatic cancer cell lines BxPC-3, PANC-1 and MIAPaCa-2 after transfection with siRNA against RBM3 or negative control (CTRL). (B) RBM3 relative mRNA expression levels in cancer cells after transfection with siRNA against RBM3 or siRNA negative control. (C) Representative images of COX-2 protein expression following transfection, as well as COX-2 and IL-8 relative mRNA expression levels in cancer cells after RBM3 suppression. Images and graphs represent one of at least three independent experiments. Representative images have been taken at 20X magnification with cellSens dimension software. Scale bar represents 20 μm. N.D. = not detected. ***p < 0.001

