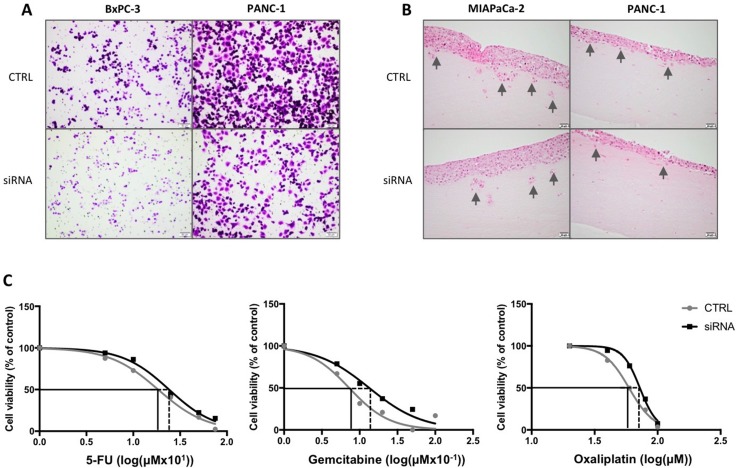
Figure 4. Influence by RBM3 suppression on cancer cell behavior.
(A) Representative images of transwell migration with BxPC-3 or PANC-1 cells after transfection with siRNA against RBM3 or control. (B) Representative images of organotypic gel sections stained with hematoxylin and eosin after 7 days incubation. All images were taken at 10X (A) or 20X (B) magnification using cellSens dimension software. Scale bar represents 20 (B) or 50 (A) μm. (C) Graphs represent cell viability after incubation with gemcitabine, oxaliplatin and 5-FU of MIAPaCa-2 cells with or without suppressed RBM3, relative to control (no treatment). Grey lines represent cells transfected with negative control siRNA, and black lines the RBM3 suppressed cells. Significant differences between control and siRNA were analyzed with non-linear regression.

