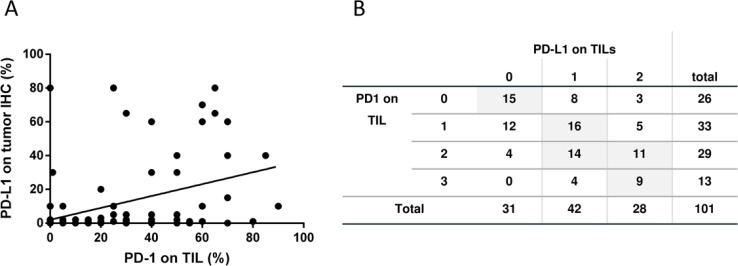
Figure 4. PD-1 and PD-L1 expression on tumor and immune cells.
(A) Correlation between PD-L1 expression on tumor cells and PD-1 expression on TIL is displayed (person rho = 0.469; p < 0.001; n = 99). (B) The correlation between PD-L1 and PD-1 expression on TIL are displayed as number and % in groups belonging to both scores (Spearman-Rho = Spearma n = 0.493 (p < 0.001, n = 101).

