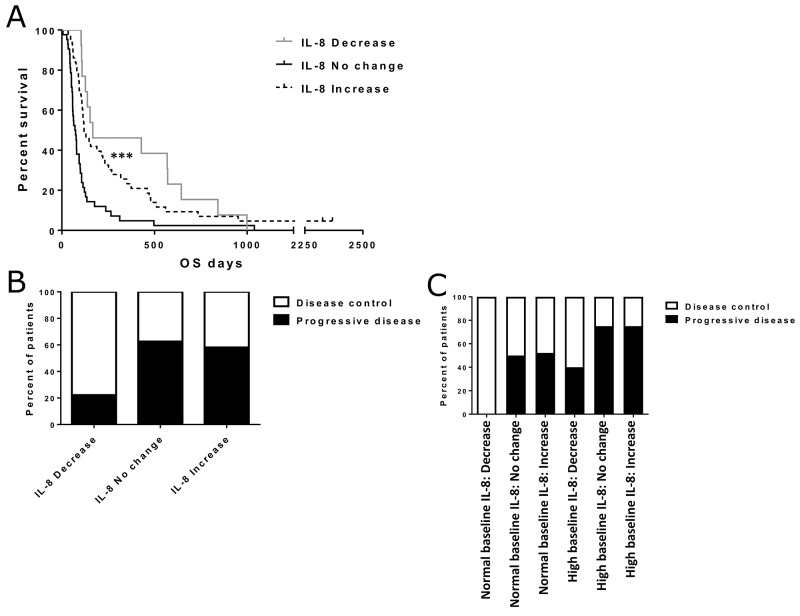
Figure 2. Effect of IL-8 change status on overall survival and treatment responses.
Asterisks indicate statistical significance: *** p<0.001, ** p<0.01 and * p<0.05. (Panel A) Overall survival in different IL-8 change groups. Median survivals were 167, 71 and 120 days for decrease, increase and no change groups, respectively (p<0.001). (Panel B) Disease control rates for patients with IL-8 decrease (n=9), increase (n=31) and no change (n=16). Fisher’s exact test p=0.066 (after pooling no change and increase groups). (Panel C) Separate disease control rates in IL-8 change groups for patients with normal or high baseline IL-8 (normal IL-8: decrease n=4, no change n=8, increase n=23. high IL-8: decrease n=5, no change n=8, increase n=8). The differences in disease control rates were not considered significant (Fisher’s exact test p=0.177).

