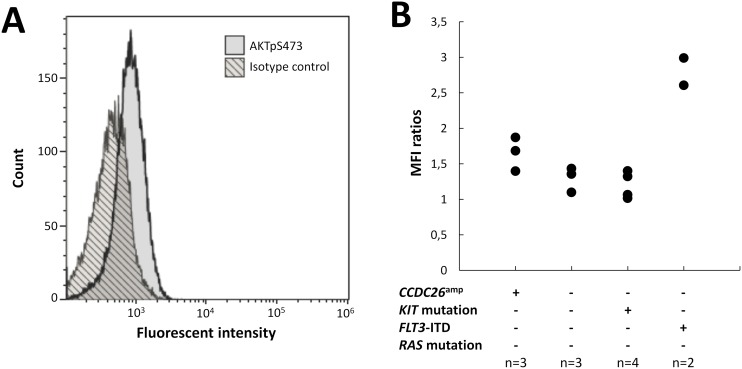
Figure 5. AKTp473 expression in blasts from CBF-AML patients.
(A) AKTpS473 expression level in a patient with CCDC26 focal amplification (CCDC26amp). (B) AKTpS473 mean fluorescent intensity ratios according to CCDC26 focal amplification and KIT/FTL3/RAS mutational status. Ratios were calculated as (MFI of blast cells)/(MFI of isotype IgG control).

