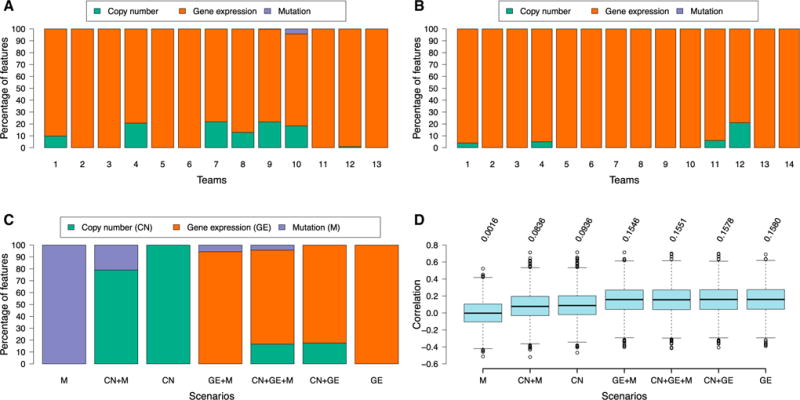
Figure 3. Analysis of the Influence of Different Molecular Feature Types on Model Performance.

(A and B) Percentage of feature types (copy number, gene expression, and mutation) used by each team, for (A) sub-challenge 2 and (B) sub-challenge 3. (C and D) Percentage of feature types (C) and predictive performance (D) by Lasso on sub-challenge 2 using copy number, gene expression, and/or mutation.
